Do you want to create custom exploration reports in Google Analytics 4 (GA4)? These custom reports help you focus on the data and metrics that are truly important to your site.
Data collection and reporting in GA4 works a little differently than in the previous version of Google Analytics. However, you should be able to get most of the same information once you’re comfortable navigating GA4’s custom reports.
In this post, we’ll show you how to create a custom exploration report. This should give you a great understanding of how custom reports work in GA4. Then, you can create and share your own reports based on your individual needs.
How to Create a Custom Exploration Report in GA4
Ready to create your first custom report in GA4? Follow these steps to learn the basics.
- Select Custom Exploration Template
- Pick a Date Range
- Select Segments
- Choose Dimensions
- Choose Metrics
- Select Filters
1. Select the Free Form Exploration Template
First, log into Google Analytics and click the Explore tab in the left sidebar menu. Then, select Free form from the template list to the right.
You can also start with the Blank template to create a free form report, but the free form template preloads some of the data options. That makes it easier to drag and drop different elements around to create a new report.

GA4 Explorations: Variables vs. Tab Settings
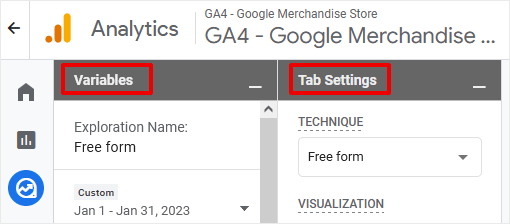
When you first open the custom free form report template, you’ll notice two columns on the left of the report display: Variables and Tab Settings.
Variables
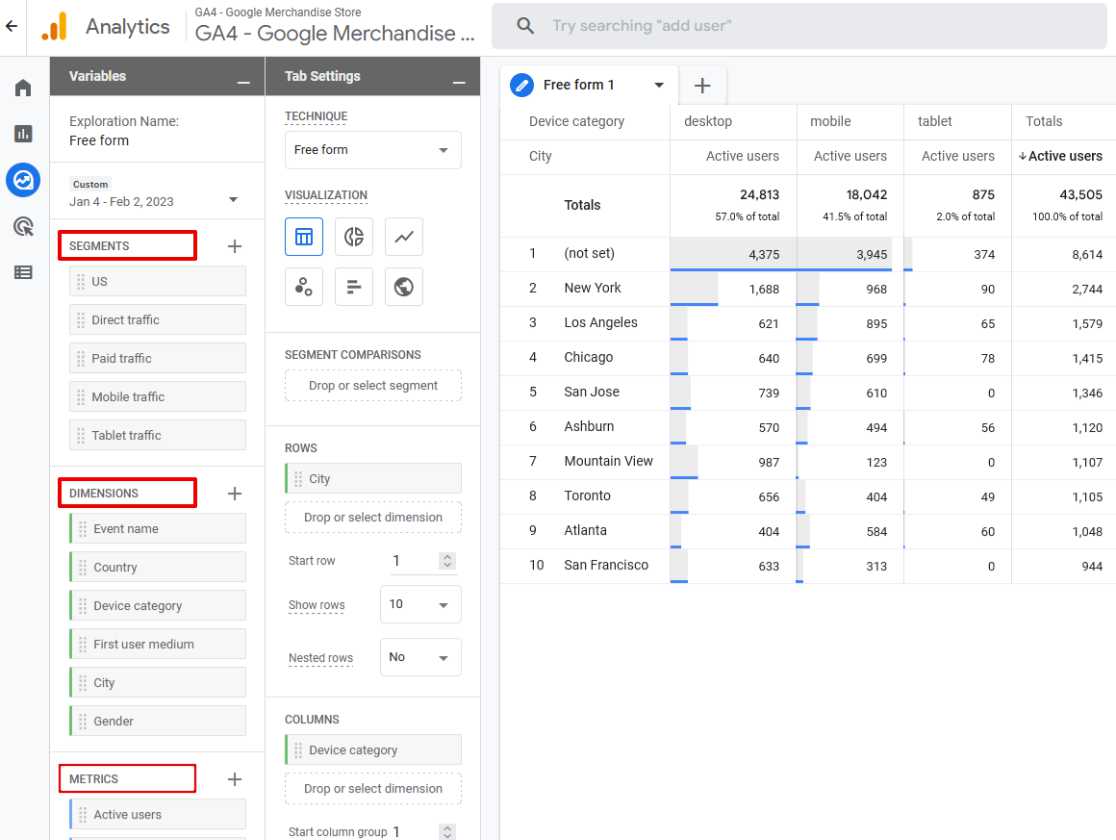
In the Variables column, you’ll choose all of the variables that you want in your report. Variables include Segments, Dimensions, and Metrics.
Here, you should also give your custom report a new name by typing it into the Exploration Name field.
Tab Settings
In the Tab Settings column, you define the style of the report and what it contains. You will drag and drop segments, dimensions, and metrics from the Variables column here to create your report.
2. Pick a Date Range
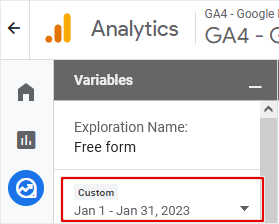
Choose a date range for your report. The default shows you the past 30 days, but you can change this to display any time period you like.
3. Select Segments (Optional)
Segments in GA4 are the same as they were previously. A segment is simply a way of defining traffic sources, based on device, location, or some other criteria.
A few examples of segments:
- Traffic from a certain geographic location, like country or city
- Mobile vs. desktop traffic
- Users who have made a purchase
- Traffic by channel (direct, organic, paid, social, etc.)
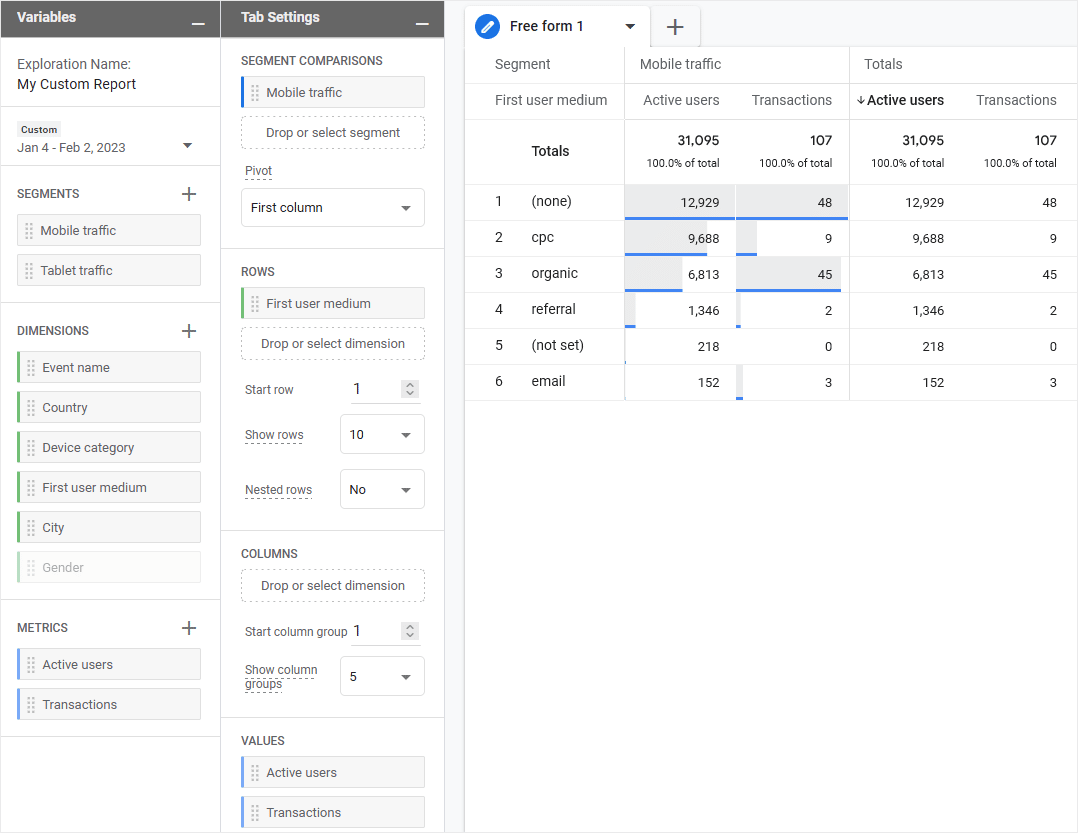
If you want to filter your report by segment, drag one of the Segments from the Variables tab to the Segment Comparisons area. Here, let’s go ahead and add Mobile traffic, so that our report will only include site traffic from mobile users.
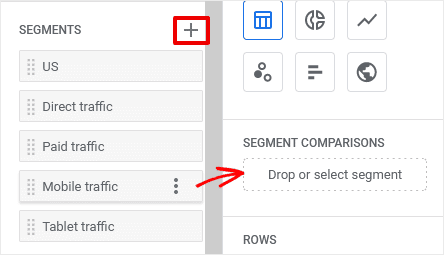
If you don’t see the segment you want in the list, click on the + sign to choose other segments or create a custom segment.
4. Choose Dimensions
Now, you’ll add any dimensions you want to include in your report. Let’s choose First user medium to see what originally brought these visitors to our site. Again, simply drag the dimension from the Variables tab to the Rows area.
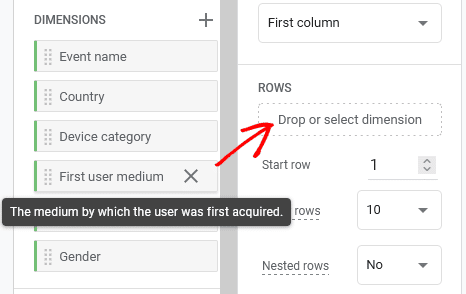
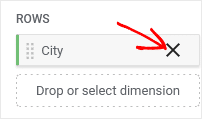
If you need to delete any unwanted dimensions, segments, or metrics from the Tab Settings column, just click the X in the box. This will remove the variable from your report, but it will still be available if you decide to add it back later.
To add a dimension that isn’t shown on the default list, or to create a custom dimension, click on the + sign above the list of available Dimensions. Then, you’ll be able to select from any existing dimensions, or create your own.
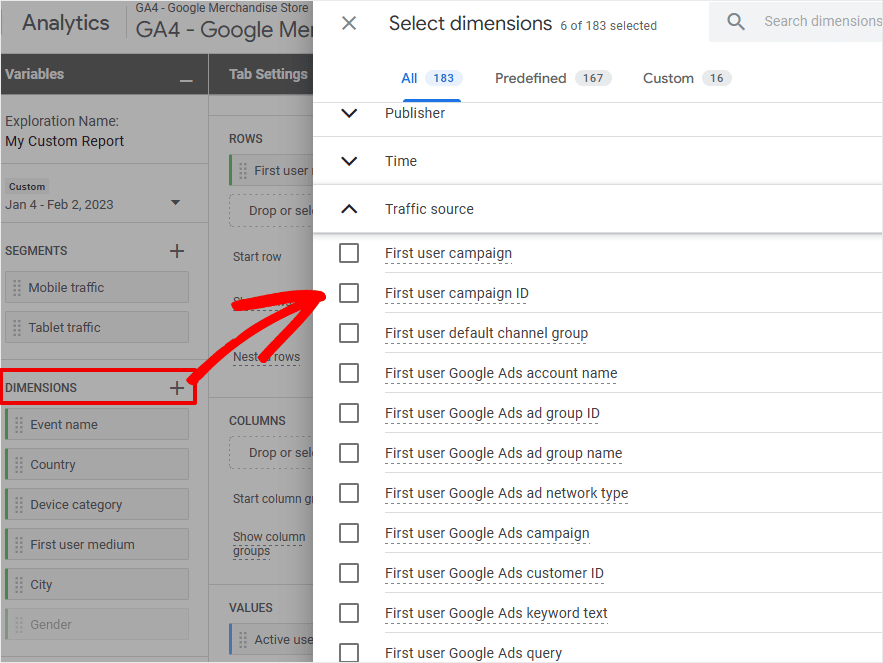
5. Choose Metrics
Now, you’ll select the metrics that you want to see for your dimensions. Metrics show you a numerical value. You might want to see the number of users, page views, or purchases, for example.
In this example, we want to see the number of active users and the number of transactions. So, we’ll go ahead and drag the Transactions metric from the Variables column to the Tab Setting column, right under Active users.

As with segments and dimensions, you can add additional metrics by clicking the plus sign to open a list of all available metrics. This shows you all the possible metrics available, including any custom metrics you’ve created.
For now, we’ll leave our report as is. Remember, our report includes only the Mobile traffic segment, and shows the dimension First user medium, with the numbers (metrics) of Active users and Transactions.
9. Select Filters (Optional)
If you need to filter the data in your report, the Filters box underneath Values is where you can add your filters. You can drag and drop dimensions or metrics into your filters, depending on what you’re trying to set up.
In this example, let’s filter our results to show only the visitors from the United States. To do that, go to the bottom of the Tab Settings column and drag a dimension or metric into the Filters area. We selected the Country dimension so that we can filter our visitors from the US. Now, you’ll set the filter criteria to say exactly matches – United States.
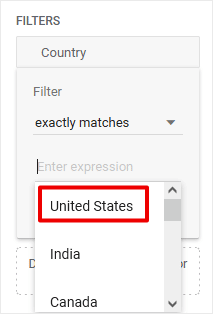
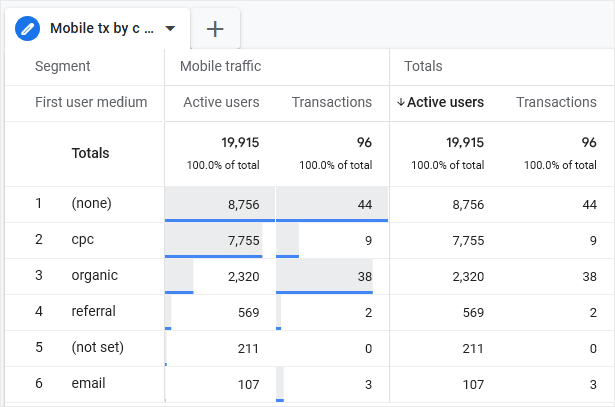
Click Apply to apply your filter to your report. At that point, you’ll see a new report with your filtered results. In this view, we only see Active users and Transactions from the United States.
That’s it, now you should have a good understanding of how custom exploration reports work in GA4. It’s actually pretty easy to experiment with custom reports to tailor your traffic stats and data to perfectly suit your needs.
Viewing Saved Custom Exploration Reports
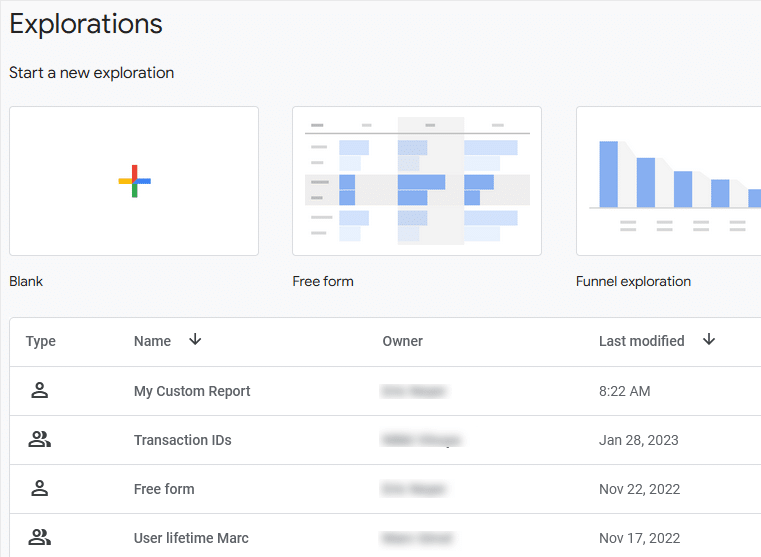
Custom reports in GA4 are automatically saved as soon as you create them. To view your previously created reports, just click back on the Explore tab in the main GA4 menu. You’ll see the list of all available custom exploration reports. Click a report name to view or edit.
If you want an even easier way to use Google Analytics 4 on your WordPress website, you can use ExactMetrics. It’s the best premium Google Analytics plugin for WordPress, and you get all the numbers that really matter right in your dashboard.
ExactMetrics can give you more than just basic traffic stats, though. It can also automate your setup of advanced tracking for eCommerce, forms, video stats, and much more.
We hope this article helped you learn something new about navigating Google Analytics!
If you liked this article, you might also want to check out how you can check your SEO rankings using Google Analytics.
Still not using ExactMetrics? What are you waiting for?
And don’t forget to follow us on Twitter and Facebook for more helpful Google Analytics tips.


