
Are you curious about how visitors move through your site and where they might drop off? A Google Analytics funnel report can shine a light on this journey, helping you see where visitors are heading and where they’re saying ‘no thanks.’
Creating a Google Analytics funnel report lets you dive deep into people’s paths on your site. But, if you’re new to this, making a funnel report might seem like climbing a mountain without a map – it’s tough!
Don’t worry! We’re here to guide you through each step of creating a Google Analytics funnel report. By the end of this guide, you’ll be able to see precisely how your visitors navigate your site and find ways to make their journey smoother.
Here’s what we’ll cover:
- The Benefits of Google Analytics Funnel Reports
- How to Create Google Analytics Funnel Reports
- Bonus: Easy GA4 Funnel Reports in WordPress
The Benefits of Google Analytics Funnel Reports
Here are some of the cool things you can learn from a Google Analytics funnel report:
- Spot where visitors leave: Find out at which point visitors are leaving your site. Is it before adding items to the cart or before making a purchase?
- Understand your audience better: Knowing where people drop off helps you understand why they might not complete the journey. Maybe a page is too slow, or the checkout process is too complicated.
- Improve your site: You can improve your conversion rate with this info. Maybe you need to make a button bigger, make the checkout process more straightforward, or make a page easier to find.
Tracking your user journey with a funnel report means there’s no need for guesswork. The report allows you to make informed decisions using actual data to improve user experience and boost conversion rate.
How to Create Google Analytics Funnel Reports
Are you ready to create a Google Analytics 4 (GA4) Funnel report and track your user journey?
Let’s get into it in the next few steps:
- Step 1: Create a Blank Exploration Report
- Step 2: Select the Correct Report Option
- Step 3: Add Your Funnel Steps
- Step 4: Check Out Google Analytics Funnel Report Example
Step 1: Create a Blank Exploration Report
The first step is to create a blank GA4 Funnel Exploration report.
First, go to Google Analytics. Once you’re there, look for the Explore tab and click it.

Inside, you’ll find a Blank option—click on that to start a fresh report.
![]()
Google Analytics offers a Funnel exploration template that gives you a peek at what a funnel report looks like. We’ll take a look at that example later.
However, it might be a bit overwhelming initially because it already has many settings. When you’re just starting and want to tailor a funnel that perfectly fits your website, beginning with a blank report is the way to go.
This clean slate approach lets you build your funnel report step by step, ensuring it aligns with what you need to know about your visitor’s journey.
Step 2: Select the Correct Report Option
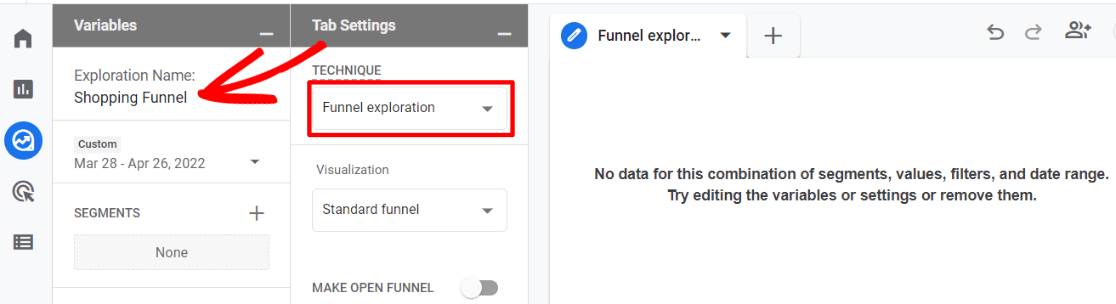
Next up, it’s time to give your report a personal touch. Start by naming your report—choose something that’ll help you remember it at a glance. Then, pick the time frame you’re interested in exploring. This could be the last month, quarter, or period that aligns with your needs.
After that, look for the Technique dropdown menu. You’ll see a few options here, but you’re looking for Funnel exploration. Click on it to select this option.

Step 3: Add Your Funnel Steps
Now, let’s roll up our sleeves and map out your funnel steps. To start, click on the pencil icon located in the Steps box:

In the step builder area, you get to name each step of your funnel, set up conditions that define the step, and add more steps as needed. Think of it as laying out the path you expect your visitors to take:
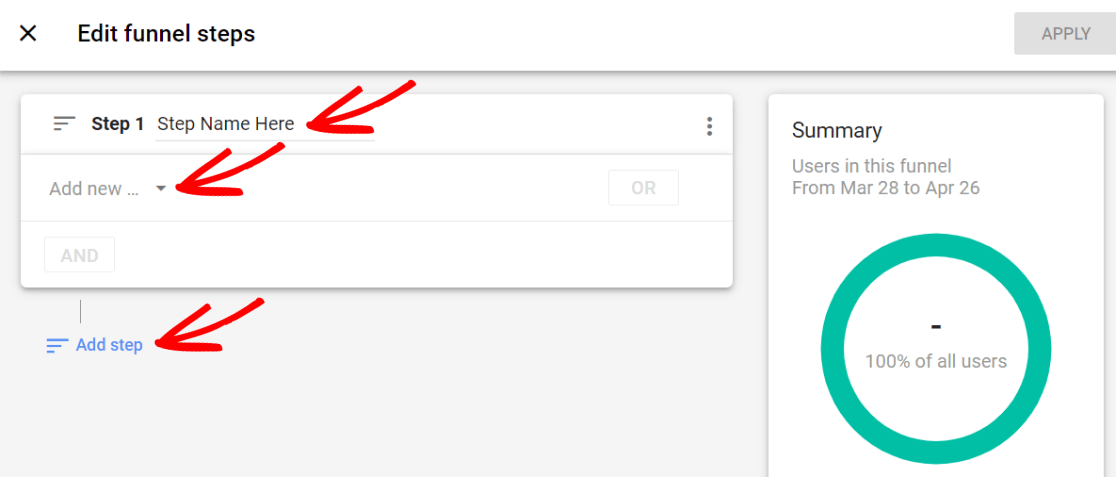

As you build your funnel, keep an eye on the Summary card on the right side of the screen. It updates in real time, showing how many users your funnel will capture. This feature is handy for checking that everything’s set up correctly without any mistakes.
You’ll notice a whole array of options when adding a new condition. It’s pretty awesome because it lets you tailor your funnel in many ways, but it can also feel like a lot to take in initially.

If you’re setting up a funnel for an eCommerce site, a straightforward approach is to use specific events as your steps. For example, you might use view_item for the first step, add_to_cart for the second, and purchase for the final step:

Alternatively, you could track the journey through page URLs, like visiting the cart page, moving on to the checkout page, and finally reaching the confirmation page. Tracking using URLs makes sense if your checkout journey is a bit more complex.
After hitting Apply, your Google Analytics funnel report is displayed:

It shows how many users completed each action and where they dropped out within your selected timeframe.
For instance, if the report shows a 75,64% abandonment rate at step one, it means 75,64% of users who viewed an item didn’t proceed to add it to their cart.
And from those who added an item to their cart, 80,56% didn’t go through with the purchase. This insight is invaluable for understanding where and why potential customers might leave without buying.
You might want to make your product offer more attractive in this example. This could be done by adding a limited-time discount, free shipping, or something else. Additionally, you could look into your checkout process. Is it too complex, slow, seems unsafe, or includes too many steps?
GA4 funnel reports are great for pinpointing where you are losing your visitors and developing strategies to improve your abandonment rate based on this information.
Next, let’s look at Google Analytics’ funnel report example to get more ideas for additional data to analyze.
Step 4: Check Out Google Analytics Funnel Report Example
Now that you’ve built your funnel, it’s time to draw inspiration from the pros. Let’s dive into an example straight from Google. Return to the Exploration tab and click Funnel exploration. Here, you’ll find a pre-made report waiting for you:

Take a moment to observe how Google sets up its funnel, especially the Device category in the Breakdown box:

This neat trick segments the funnel data by device, giving you a clear view of how users on different devices move through your site.
It’s a great way to spot if tablet visitors, for instance, are dropping off more than mobile visitors, which could indicate tablet navigation issues.
Google’s example also includes pre-set segments in the report. Try experimenting by dragging a couple of these segments into the Segment Comparisons box.
You could, for instance, take a look at your user journey for direct and paid traffic and see how they compare against each other:

Watching how the report changes with these adjustments can be incredibly eye-opening. The more you experiment with different settings and segments, the better you’ll become at crafting reports that reveal exactly what you want to know about your visitors’ behavior.
Bonus: Easy GA4 Funnel Reports in WordPress
For those with an online WordPress store along with WooCommerce or Easy Digital Downloads, there’s a shortcut to accessing the funnel report without the hassle. The secret? Install ExactMetrics, and let it do the heavy lifting for you!

ExactMetrics shines as the top premium plugin for Google Analytics. It connects your WordPress site with Google Analytics effortlessly, bringing vital analytics straight to your WordPress dashboard.

With just a few clicks, ExactMetrics unlocks advanced tracking capabilities. You can track events, eCommerce activities, form submissions, custom dimensions, outbound links, and much more without ever leaving WordPress.
After setting up ExactMetrics Pro, it automatically generates an eCommerce report. This means you get details about landing page conversions, top products, revenue, user journey, and much more:

Additionally, the eCommerce funnel report in the ExactMetrics dashboard will show the user flow on your site—from viewing products to adding them to their carts to making purchases.
To find this goldmine of information, navigate to ExactMetrics » Reports » eCommerce » Funnel. Here, you’ll see the user journey laid out clearly, helping you make informed decisions to boost your online store’s success:

Get started with ExactMetrics today.
And that’s it!
We hope you liked this article and get the best out of your Google Analytics funnel reports. Be sure also to read:
- How to Track Cart Abandonment Rate in Google Analytics
- How to Find Average Order Value in Google Analytics 4
- How to Track Google Analytics Custom Events (WordPress)
Not a user of ExactMetrics yet? What are you waiting for?
Don’t forget to follow us on Twitter and Facebook for the latest tips and tutorials on Google Analytics.