Do you know what user engagement metrics are and how they can benefit you? User engagement metrics show you important details about how visitors use and interact with your website.
We’re going to show you how to find these statistics and how you can use engagement metrics to improve your site’s performance.
Ready? Let’s find out what user engagement is and why it’s important.
What Is User Engagement in Google Analytics?
User engagement in Google Analytics refers to certain user behaviors on your website. For example, the length of time that an average user spends interacting with your site is called Average engagement time.
Other engagement stats measure things like user scrolls, page views per user, and so on.
Top Engagement Metrics in Google Analytics
Google Analytics reports a number of default metrics to measure user engagement. The top ones are:
- Engagement Rate
- Average Engagement Time
- Key Events (Conversions)
- Engagement Time per Page
You may want to note that Google Analytics does not report bounce rate (the percentage of visitors who land on your site but don’t take any action like scrolling, clicking a link, or similar) as a default statistic. Instead, you’ll need to pay attention to a metric called Engagement Rate. That stat measures what percentage of visitors did at least one of three things:
- Stayed on a page on your site for at least 10 seconds, OR
- Viewed at least two web pages, OR
- Completed any type of key event or conversion.
When users are engaged, that means they’re actually reading your content, clicking menu links, or interacting in some other way. So, many user engagement metrics are based on the number of engaged users and engaged sessions.
Now, let’s get started with our complete guide to engagement metrics in Google Analytics!
We’ll start by describing the most important user engagement metrics you’ll need to know in Google Analytics.
1. Engagement Rate
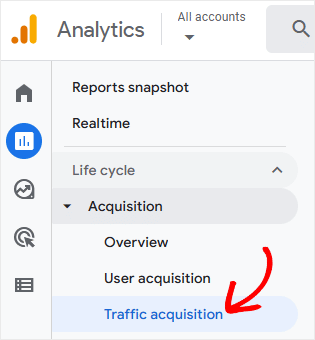
The engagement rate is the number of engaged sessions divided by the total number of sessions. This is supposed to tell you how many of your visitors are actively engaged with your site. To see the engagement rate metric in Google Analytics, click the Reports icon in the left sidebar, then click Acquisition » Traffic Acquisition.
Now, you’ll see a couple of graphs and a table that show details about where your traffic came from. That includes how many visitors came from an email link, a search engine, a paid ad, and other sources.
In the graph on the bottom half of the page, Google shows you the number of total website users, total sessions, engaged sessions, and the engagement rate, among other metrics.

While engagement rate can be seen as the opposite of bounce rate, it’s measured in a different way. Still, higher engagement rates are definitely better than lower ones.
How to Use the Engagement Rate Metric
What do engagement rates tell you? Well, in the graph above, you can see that the engagement rate for traffic that came from email engaged at a rate of 79%. On the other hand, users who came from paid searches were only engaged 49% of the time.
This stat shows that visitors who came from an email link were more engaged than traffic from other sources. Those users already have a relationship with your business or your site, so they may be expected to show more interest and stay longer.
These numbers might also tell you that you need to set up better audience targeting in your ad campaigns. Perhaps you’re not really reaching the right people if only half of those who click your ad want to interact. Or, perhaps your ad copy is misleading, and people click thinking your website is about something it’s not.
These are some of the potential issues that you can diagnose and fix with the help of the engagement rate metric.
2. Average Engagement Time
Now, let’s look at a metric called average engagement time. You’ll find this stat in Google Analytics in the Reports » Engagement » Overview screen.

You should monitor your site’s average engagement time to see how it changes over time. Generally speaking, you want this number to increase or remain stable, not decrease.
That’s because people who stay on your site longer are more likely to turn into paying customers, subscribers, or fans. So, how do you get people to stay longer? There’s no magical answer except to improve your visitors’ experience as best you can.
That’s why average engagement time is a valuable metric. It’s an overall measure of how much users enjoy interacting with your content. While there’s no standard for what a “good” average engagement time is, what’s important is how it trends over time.
3. Key Events (Conversions)
The next critical user engagement metric you should know is key events or conversion rate. You’ll find the key events (previously conversions) numbers for different events on your website in multiple reports, including the Traffic acquisition report:

Here, you can see every channel that you got traffic from and how many times each key event happened. A couple of classic examples of key events are when someone fills out and submits a form on your site, completes a purchase, or makes a donation.
As you can see in our example, there were 1,199 key events triggered by users who visited via email. If we divide that number by the total number of key events and then multiply by 100 to get a percentage, we can see that 1.64% of key events are completed by users who come from the email channel.
Tracking Other Conversions
Conversions don’t have to be monetary. In fact, you can define many different activities as conversions. You can set a conversion when a visitor downloads a file, subscribes to your list, or clicks an affiliate link on your site.
To set up other conversions besides purchases in Google Analytics, go to the Configure screen.

There, a table shows you a number of different events that you can track as conversions (key events). Simply flip the switch for any event you want to add as Key events to your reports.

In this example, we’re marking the contact_us and generate_lead (which is usually form submission) events as key events.
4. Engagement Time per Page
The average engagement time per page simply tells you the average time that active users spend on an individual web page. To find out how much time your visitors are spending on each page of your site, click the Pages and screens item in the Engagement menu.

At the top of the Average engagement time column, you’ll see the average time users are active on your entire site. Below that, you’ll find the average time that visitors spend on each of your pages. The page titles are shown in the left column.
Now, you can see if any of your numbers are surprising or unusual. For example, if you have product pages with significantly lower engagement times, what’s different about those pages compared to more successful pages? Are product descriptions and images below standard, or is there a link leading people away from those pages?
There you go, those are our 4 top user engagement metrics in Google Analytics that we recommend you’re familiar with, as a start.
More Google Engagement Reports
Google Analytics offers several other engagement reports that may be useful for more advanced users:
Events Report – Under Reports » Engagement » Events, you’ll find a complete list of the events Google is tracking on your website. Many of these events aren’t very useful or meaningful, but if you want to track a specific event, you’ll find it here.
User Stickiness – In the Engagement Overview screen, there’s a chart titled User Stickiness. This chart shows the ratios of daily, weekly, and monthly active users in comparison. It shows how many active users are recurring visitors over time. Higher ratios mean your site is more “sticky,” or in other words, it tends to attract more return visitors.

How to View User Engagement Metrics in WordPress
If you run a WordPress site, you don’t have to log in to Google Analytics every time you want to see stats on user engagement. When you use ExactMetrics, the best premium WordPress plugin for Google Analytics, you can see engagement stats right in your site dashboard.
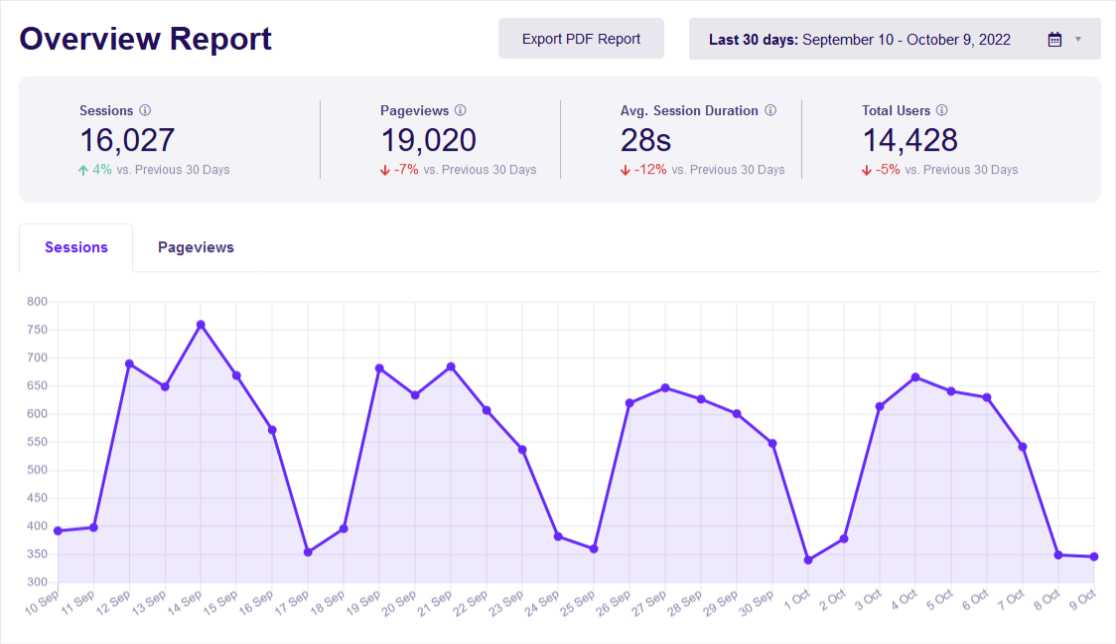
The Overview report in ExactMetrics gives you instant access to sessions, total users, and average session duration.
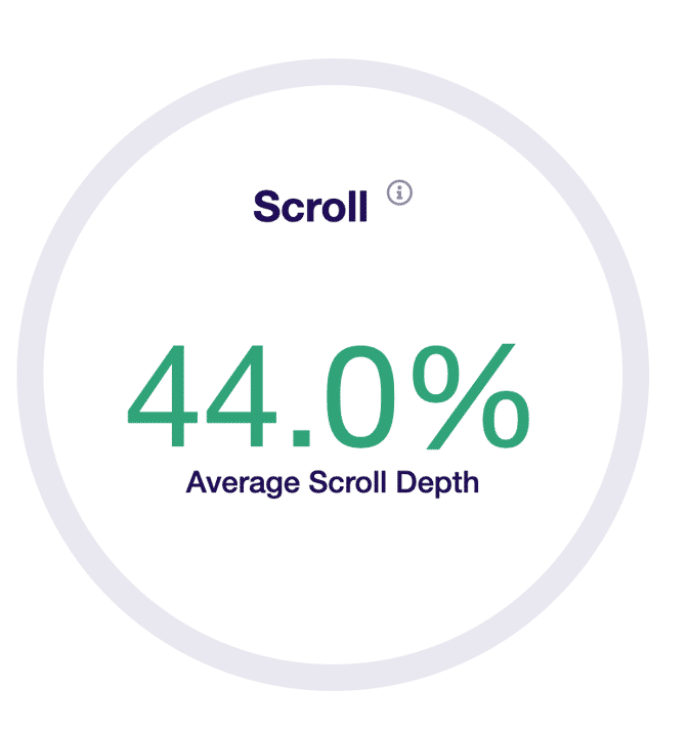
You can also see engagement metrics for your Top Landing Pages in the Publishers Overview report, such as the average session duration and bounce rate for your top landing pages. Quickly view your average scroll depth here as well.
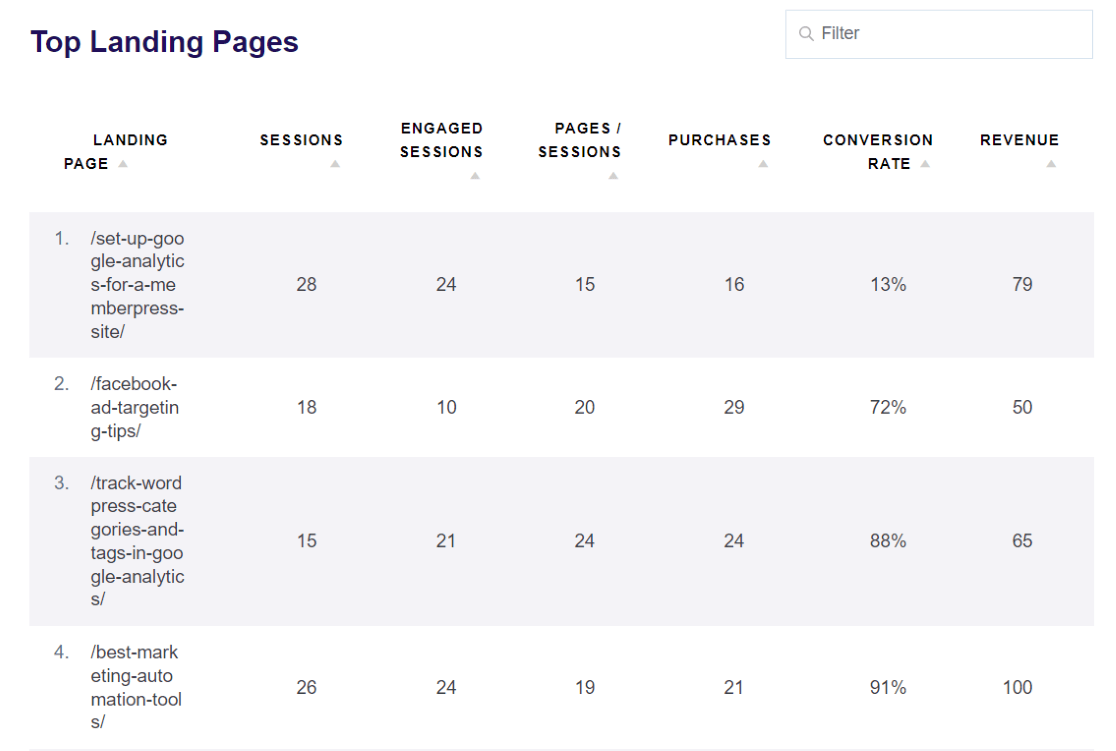
To dig deeper into your landing page engagement metrics, head to the Top Landing Pages report under Traffic. Here, you can quickly see which landing page has the most engaged sessions, pages per session, conversions, and more.
Want to see which posts and pages have the highest engagement? Just head to the Pages report to easily see the number of engaged sessions and bounce rate for your top pages.

Using ExactMetrics, you can also find engagement metrics, conversion rate, and more in your WordPress reports for:
- Campaigns (UTM parameters)
- Traffic Channels
- Session Source / Medium
- Videos (average watch time, completion rate, and more)
- Forms (impressions, conversions, and conversion rate)
- And more!
Plus, when you use ExactMetrics for eCommerce tracking, you get instant insight into your Conversion Rate, Average Order Value, and Top Conversion Sources, among other critical stats.
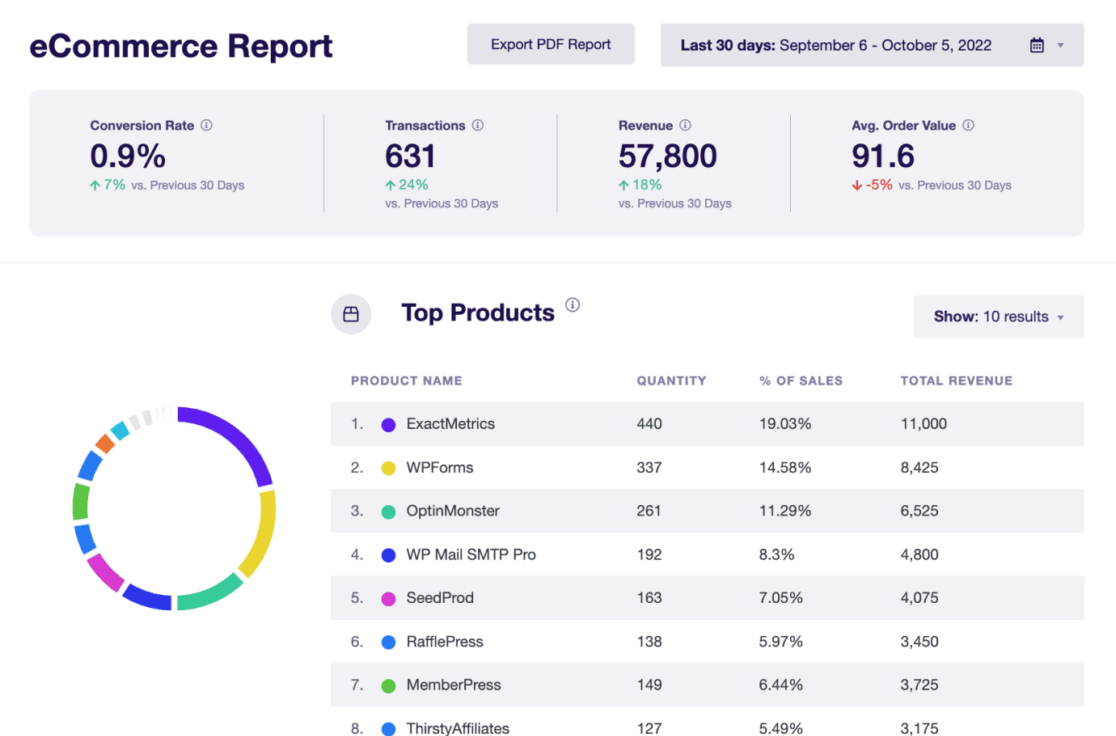
The plugin sets up eCommerce tracking in one click, so you don’t have to do any custom setup in Google Analytics. If you use paid ad campaigns, you can easily track your Google Ads performance with ExactMetrics’ Ads addon.
ExactMetrics also tracks other user engagement events inside WordPress, including affiliate link clicks, add-to-cart events, file downloads, and more.
If you want to see the user engagement stats that matter inside the WordPress dashboard, ExactMetrics is a better option than Google Analytics. And, beginners will find it much easier to set up and get the information they need.
All right, that’s all for our guide to user engagement metrics in Google Analytics, we hope you learned something new. If you liked it, check out this article on analytics metrics that every business should track.
Are you using ExactMetrics yet? If not, try it out today!
And don’t forget to follow us on X and Facebook for more Google Analytics tips and tutorials!


