Are you scratching your head trying to figure out how Google Analytics works? If so, you’re not alone. Google Analytics 4 (GA4) is an incredibly powerful free tool, but it comes with a lot of technicality and a pretty steep learning curve.
Google Analytics helps you understand your user’s behavior, track your website performance, and more. But as helpful as the tool is, it’s not very easy to use. If you’re not a Google Analytics professional, you may find GA4 pretty overwhelming. It’s difficult to navigate through the different reports and find meaningful data that you can use for decision-making.
That’s why we’ve put together this beginner’s guide to Google Analytics. You probably won’t be a Google Analytics wiz by the end, but that’s our job, and you’ll have everything you need to start using Google Analytics on your site.
Ready to get started?
How Does Google Analytics Work?
We’ll explain what Google Analytics is, how it works, and how to start using it for your website. We’ll show you how to find a number of key reports, explain their metrics, and talk about what you can do with them.
- What Is Google Analytics?
- How to Access Google Analytics
- How to Read Google Analytics + Key Reports to Track
- Best Way to Use Google Analytics for WordPress
What Is Google Analytics?
Google Analytics is a web analytics tool that you can use to track your website and visitors. It helps you understand how people use your site, so you can deliver a better user experience and grow your business. It’s a free service from Google and you can integrate it with other Google tools such as Google Tag Manager, Data Studio, Search Console, AdWords, and more.
For example, if you run a blog, you can see which posts are most popular with visitors who come from social media. For an eCommerce store, you could track which type of device customers use to make a purchase or the products they view. The list goes on and on.
What Can Google Analytics Tell You?
You can do a lot with Google Analytics. From getting insights about your customers to tracking the performance of your website, the tool offers loads of features.
Here are a few of the things you can do with Google Analytics:
- Find the number of visitors on your website
- See which posts and pages are your most popular
- Look at your top website traffic sources
- Measure the performance of your marketing campaigns
- Discover which device or browser visitors use to find your website
- See how many people converted on your website
- Track the number of online sales, viewed products, and more for eCommerce.
- Find out which countries bring in the most visitors
- Get insights about users’ interests and demographics
- … and lots more
How Does Google Analytics Work Technically?
For our techy readers, let’s go over how Google Analytics actually works…
Google Analytics collects information about your website using a tracking code or page tag. The code is made up of a programming language called JavaScript and it’s inserted on every page of your website. This code runs in a visitor’s browser and collects information.
So, when a visitor arrives on your website that has the JavaScript code, it allows Google Analytics to record important information about the user and their interactions on your site, which it sends to Google’s data collection servers. The data is then shown to you in the form of Google Analytics reports.
If that seemed really technical, don’t worry! You don’t really need to know how it all works behind the scenes. Even users who aren’t tech-savvy can use Google Analytics to get tons of valuable information.
How to Access Google Analytics
To access Google Analytics and start using it, you’ll have to create a new Google Analytics account (or add a new property to your existing account) and then add the tracking code to your website header.
If you’re not a developer, we don’t recommend the manual route since it requires coding and any mistakes can break your site. Instead, follow our simple tutorial on how to add Google Analytics to your WordPress site where we’ll take you step-by-step through the entire Google Analytics setup process without touching any code.
After you’ve set it up, log in to your Google Analytics account and you’re ready to set up conversions in the next step.
Where to Find Google Analytics Code in GA4?
If you’ve set up tracking manually or want to find your Google Analytics tracking code for any other reason, you can log in to Google Analytics and go to Admin » Data Streams. Click the data stream for your website, scroll down to the bottom, and click View Tag Instructions.
![]()
Set Up Conversions in Google Analytics
If you want to gather data about visitor conversions on your website (most people do), the process entails configuring conversions through Google Analytics. Conversions are desired actions that visitors complete such as subscribing to your newsletter, submitting a form, watching a video, purchasing a product, and more.
Google Analytics 4 offers a feature called Enhanced Measurement tracking, which automatically monitors certain events. This includes tracking actions like file downloads, form submissions, and video views. However, it’s important to note that this built-in tracking does come with limitations. For example, video tracking is exclusively compatible with YouTube videos, form tracking might encounter compatibility issues when used alongside a Facebook Pixel, and scroll tracking only triggers when a user reaches the bottom of a page.
To use Enhanced Measurement, click the Admin cog in the bottom left of Google Analytics. Then click Data Streams. Next, click the data stream for your website.
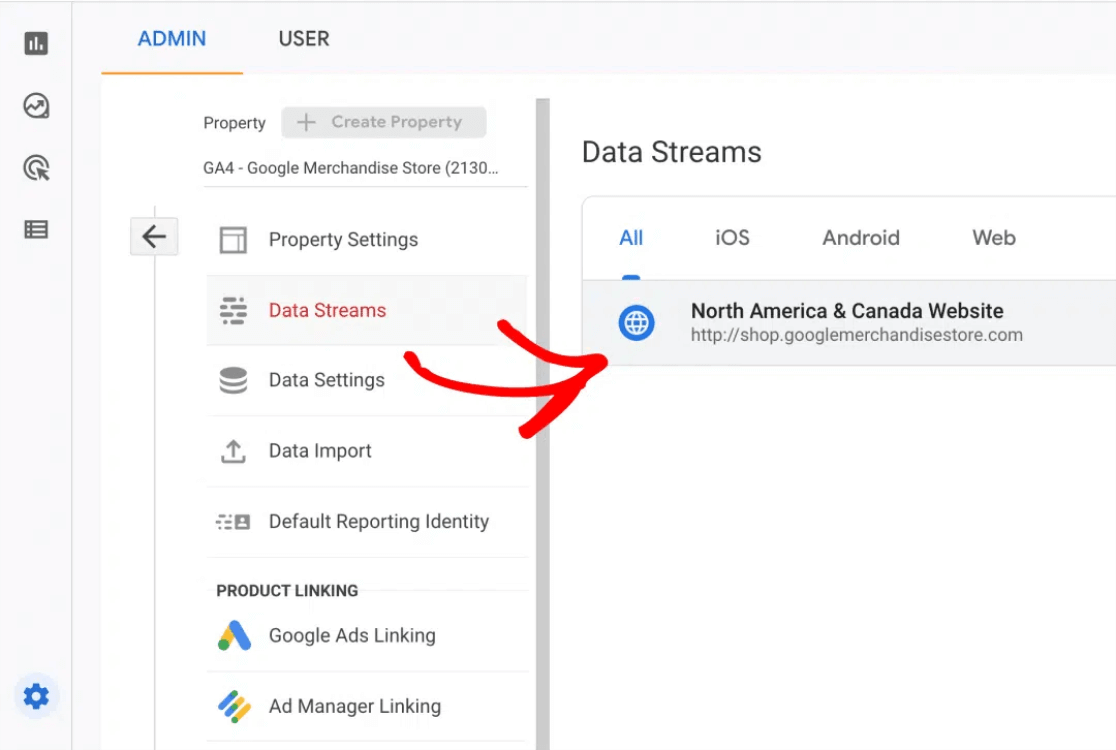
You’ll now see a section titled Enhanced Measurement. If you want Google Analytics to attempt to track events on its own, toggle the switch on.
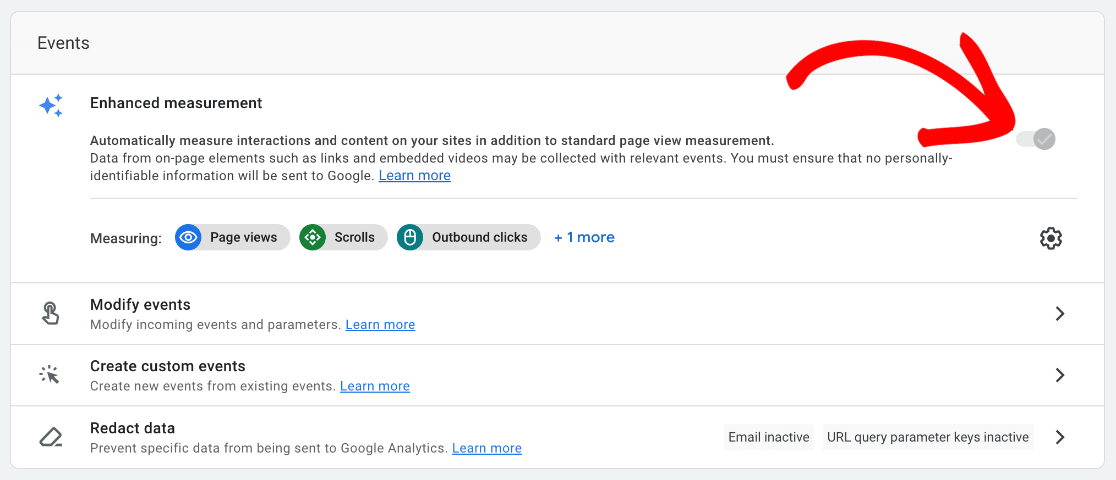
Once it’s on, you can click the Settings Cog below it to customize what’s automatically tracked.
NOTE: There’s a much simpler and more accurate way to track conversions in Google Analytics for WordPress users. Check out ExactMetrics! It’s the easiest way to set up events and track conversions in GA4. If you’re already an ExactMetrics user, make sure Enhanced Measurement is turned off as this can interfere with tracking.
Now, whether you’re using Enhanced Measurement or ExactMetrics to configure event tracking, you’ll want to mark which events should count as a conversion, which is different for every website and business.
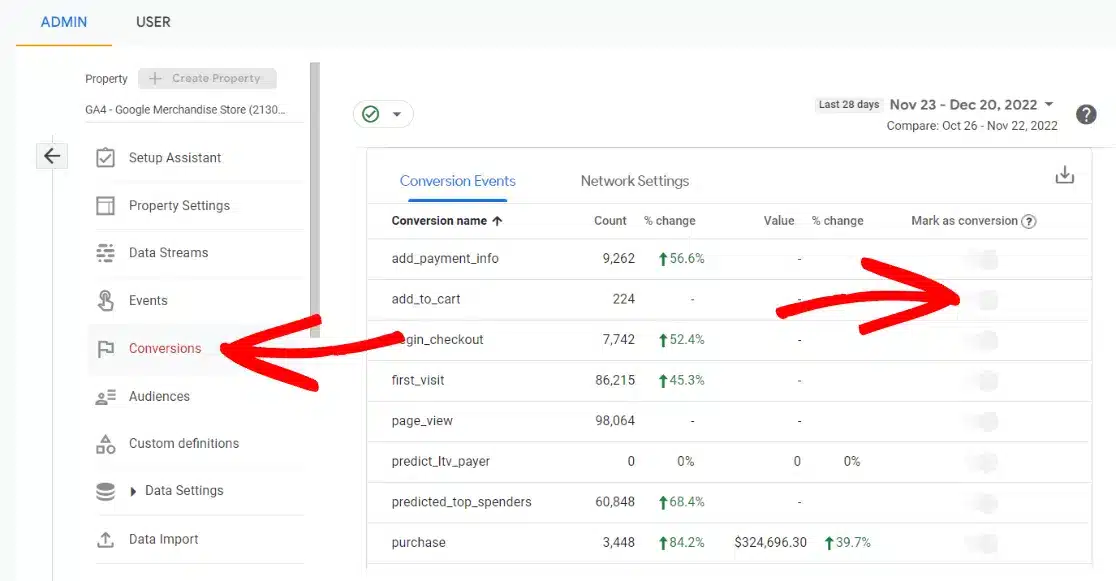
Click the Admin cog again in Google Analytics and then Events. Now you can use the switches next to your list of events to mark which actions are conversions. For example, you may want to mark when users download a file or submit a form as a conversion.
Things get a bit more complicated if you need to set up eCommerce tracking… Using WordPress for your online store? You’re in luck – learn the easy way to set up Google Analytics eCommerce tracking with ExactMetrics.
Now that you know how to access Google Analytics and have hopefully set it up on your site, we’ll dive into how to use Google Analytics to find your important data.
How to Read Google Analytics
When you first start to use Google Analytics, it can be difficult to navigate all the options and find the reports you need to make business decisions. But, we’re here to help. We’ll walk you through the key sections and explain how to read Google Analytics reports, so you can better understand how GA4 works and find the data to grow your website.
Google Analytics Home
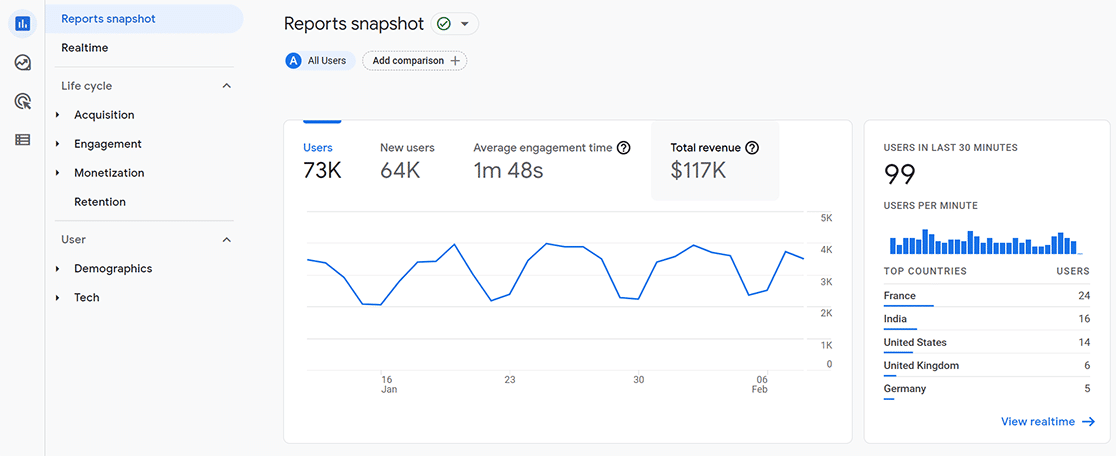
The first screen you’ll see is the Home page when you log in to Google Analytics. Here, you can see a quick overview of how your site is performing. The report shows how many Users visited your site in the last 7 days (or the date period selected) and how many of those users hadn’t visited your site before (New users).
You’ll also see the average amount of time a user spent on your website (Average engagement time) and how many events were completed (Event count). Events are things like clicks, form submissions, etc.
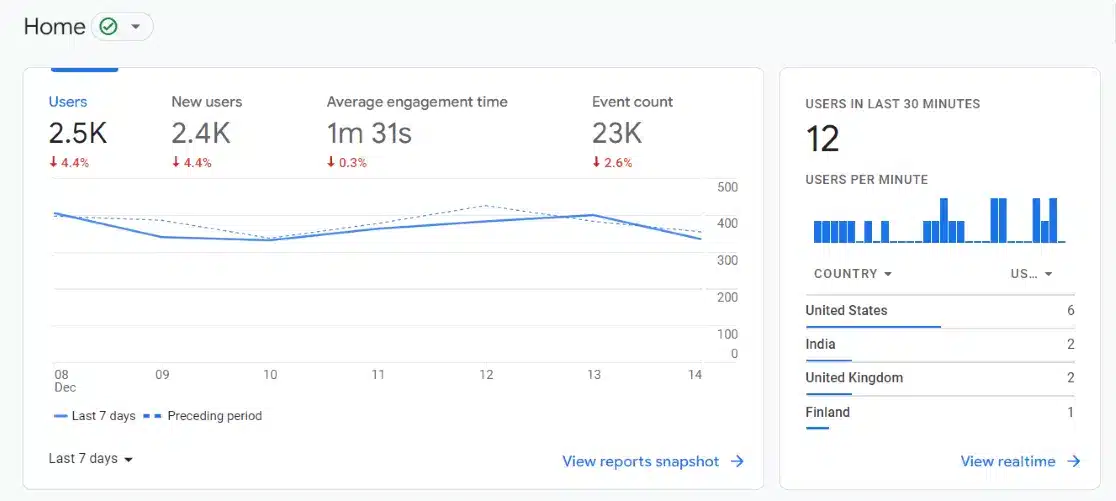
You can also see how many people are active right now on your site (last 30 minutes) along with the top countries those visitors are from. This is a snapshot of your real-time report, which will dive more into next.
If you scroll over the sidebar navigation on the left, a panel will expand, and you can click the Reports tab. This will take you to your Reports snapshot, which is your Google Analytics dashboard. You’ll use the menu on the left to access the reports we’ll be going over next.
Realtime
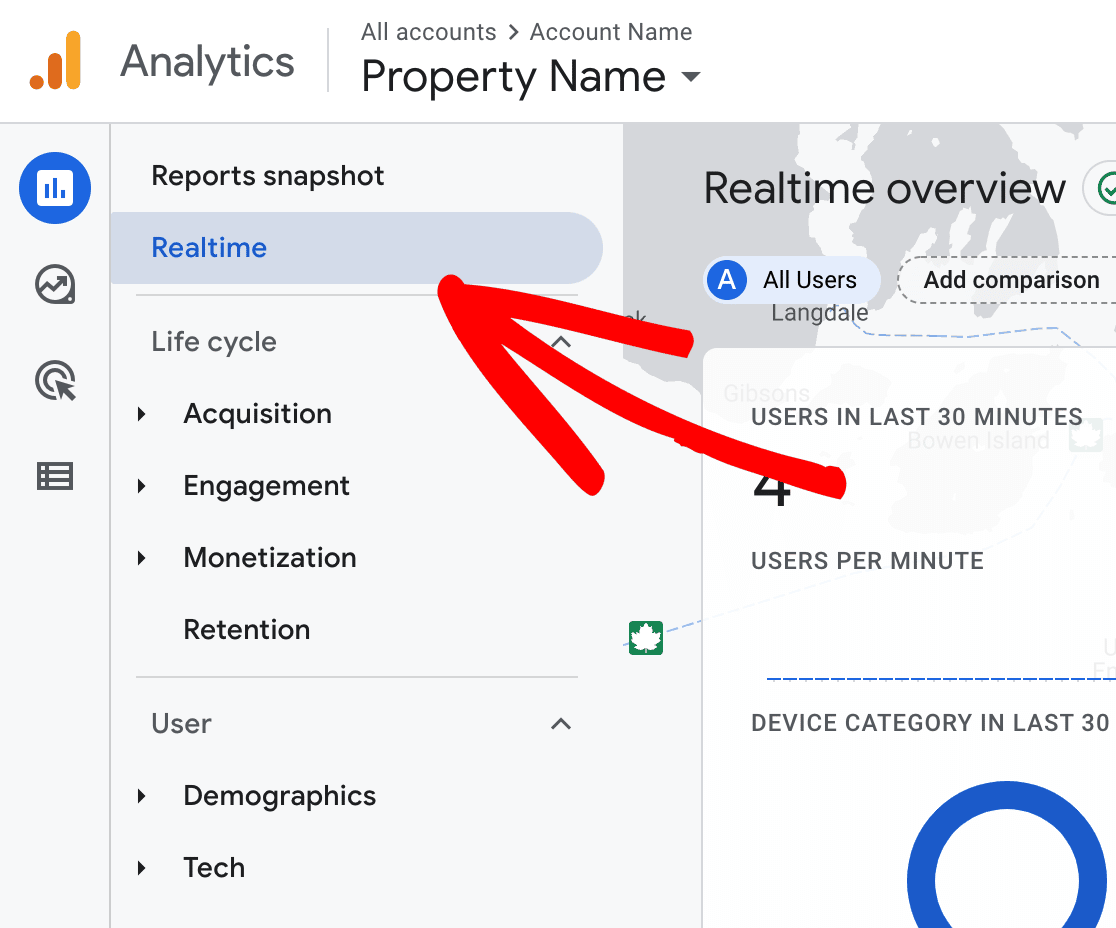
Ever wondered how many people are currently on your site, going through your web pages? With the Google Analytics Realtime report, you can see exactly that. Click Realtime from the left sidebar.
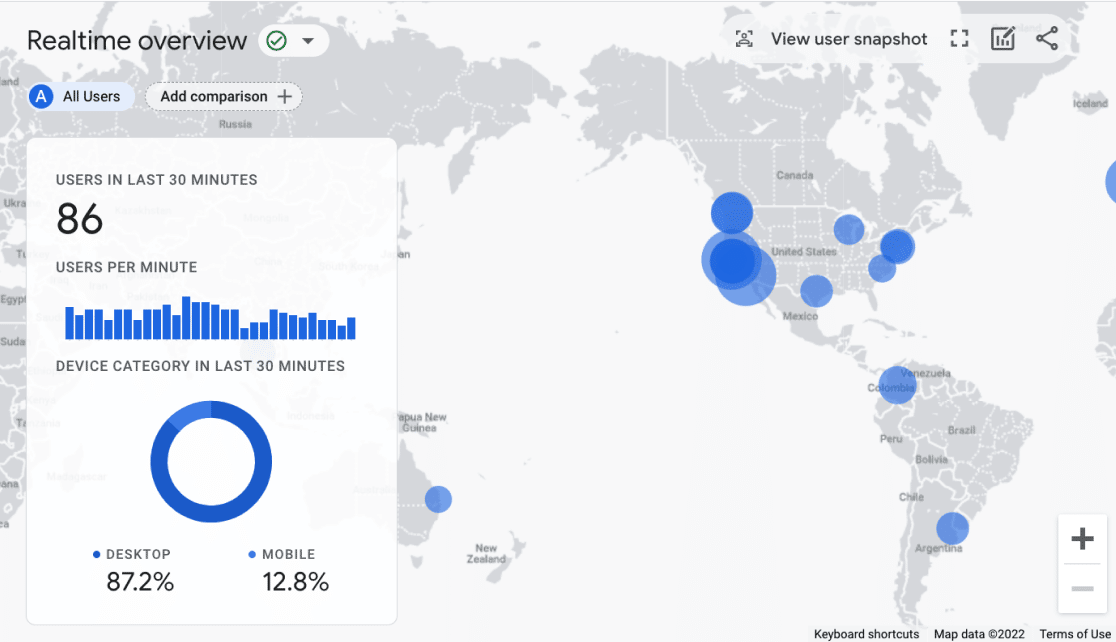
In the Realtime overview, you can see users in the last 30 minutes, users per minute, and the breakdown between mobile and desktop users along with a map that highlights the counties where those users are from.
You can scroll over the dots on the map to see which city it is and how many real-time users are from there.
And if you scroll down on the page, you’ll see more cards that give you other real-time data. For example, see the traffic sources of current users, the top active pages, and which conversion events are taking place.
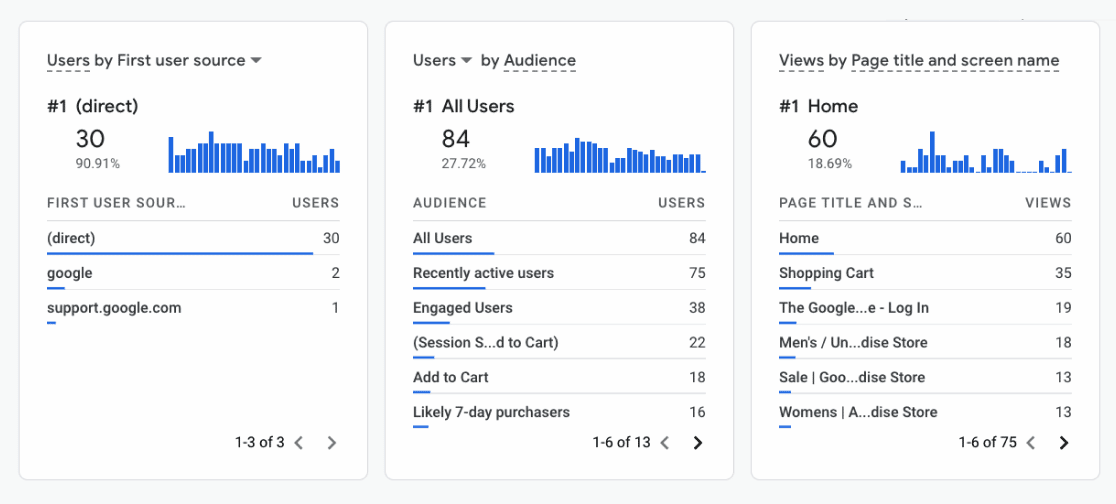
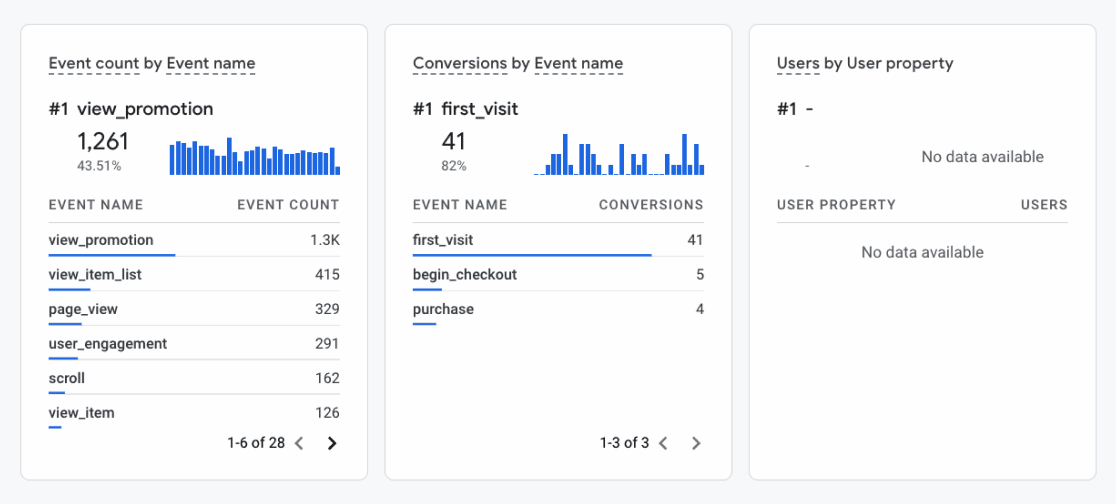
You can use the dropdown arrow on the title of certain cards to change it. For example, on the Users by Audience card, you can change it to New Users to see the audience breakdown for only real-time users who are visiting your site for the first time.
Realtime reports are excellent for measuring the performance of digital marketing campaigns. For instance, if you’re running a summer sale or giveaway on social media, you can get instant results by changing the real-time First user source card to First user campaign. That way, you can see how many people are on your site right now after launching the campaign.
Acquisition
One of the things most website owners are really curious about is where their site traffic comes from. With the Acquisition reports, you can uncover which sources visitors use to find your website.
Below Realtime in the menu panel, expand the Life Cycle section and you’ll see Acquisiton. We recommend you start using these reports by looking at Traffic acquisition.
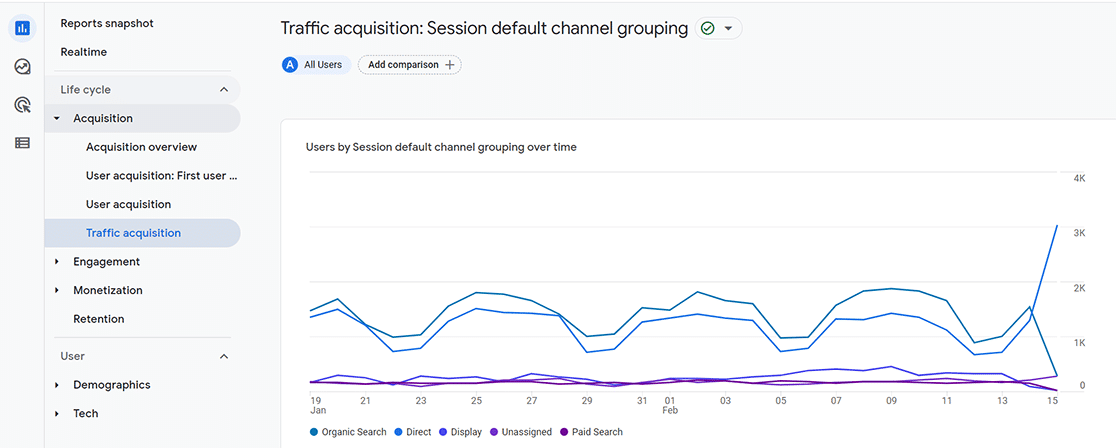
Scroll down to the table, and you’ll see a list of the channels that visitors use to find your site. This report is useful for planning your marketing strategy. You can look at which channels are not performing well to know what areas need to be optimized to boost traffic.
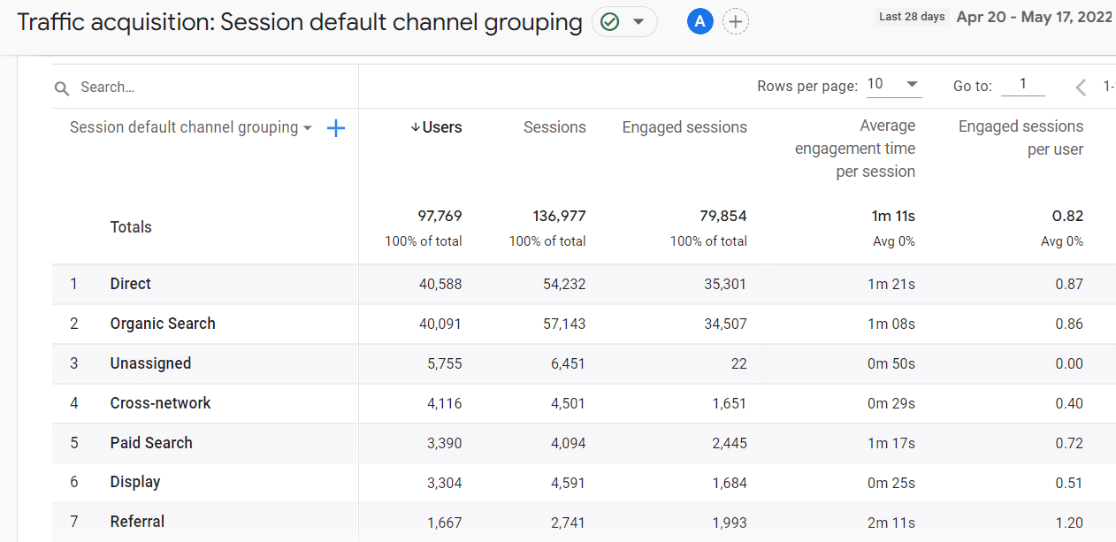
Likewise, you can see which sources drive the most traffic, and focus on those channels. For example, if you’re getting a lot of traffic from organic channels, you can focus on keyword targeting and content creation to bring in more visitors.
Which Channels Are Available in the Default Channels Report?
Google Analytics groups your traffic into different default categories. If you don’t have traffic from certain channels, you won’t see them listed. Here’s a quick breakdown of the possible traffic channels:
- Direct: When users enter your URL directly or use a saved bookmark. Any traffic that Google can’t determine a source for is also grouped under direct. Learn more about direct traffic here.
- Referral: Any non-ad link to your site on another website such as a blog or news article.
- Email: A link in an email that lands on your website.
- Affiliate: Traffic from your affiliate marketing efforts (users click an affiliate link).
- Organic: Visitors that find your site through non-ad links while searching or browsing the web. Organic is further divided into channels: Organic Search, Organic Social, Organic Video, and Organic Shopping.
- Paid: Visitors that access your site by clicking an ad link while searching or browsing the web. Paid is further divided into channels: Paid Search, Paid Social, Paid Shopping, Paid Video, Paid Other.
- Display: Traffic arriving from ads that are part of a display ad network.
- SMS: A link in a text message.
- Mobile Push Notifications: A link in a mobile device message (while not using the associated app).
- Audio: Traffic from an ad on an audio platform such as an audiobook or podcast platform.
- Cross-Network: Traffic from ads that appear on a variety of networks such as search and display.
If you want to see more data about the source of your traffic, try clicking the dropdown menu for Session default channel group and changing it to Session source/medium. This will give you more detail on which traffic sources sent visitors to your site.
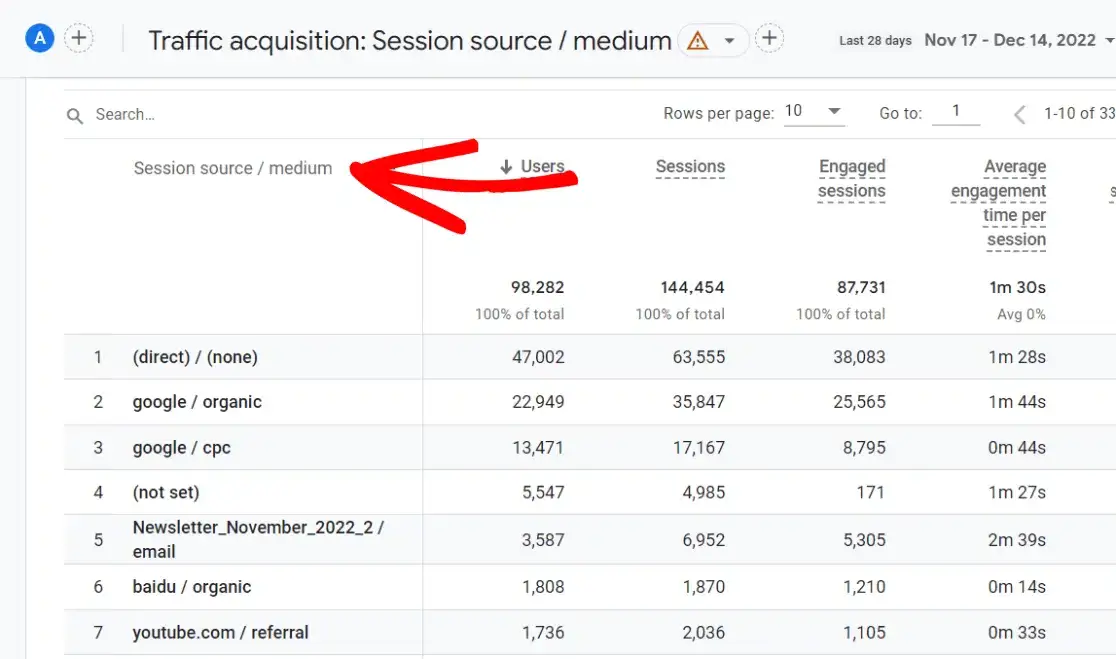
To learn more about using the traffic acquisition report, check out our tutorial on How to See Google Analytics Traffic Sources & Medium.
Engagement
After viewing your traffic sources, let’s find out how your content is performing and what visitors do on your site, like the events they trigger, whether they’re converting, and which pages they view. You’ll find these reports under Engagement.
There are a number of reports under the Engagement tab, but for Google Analytics beginners, we recommend starting with Pages and screens. It’s usually the most helpful since it includes events, conversions, and user engagement metrics for each page on your site.
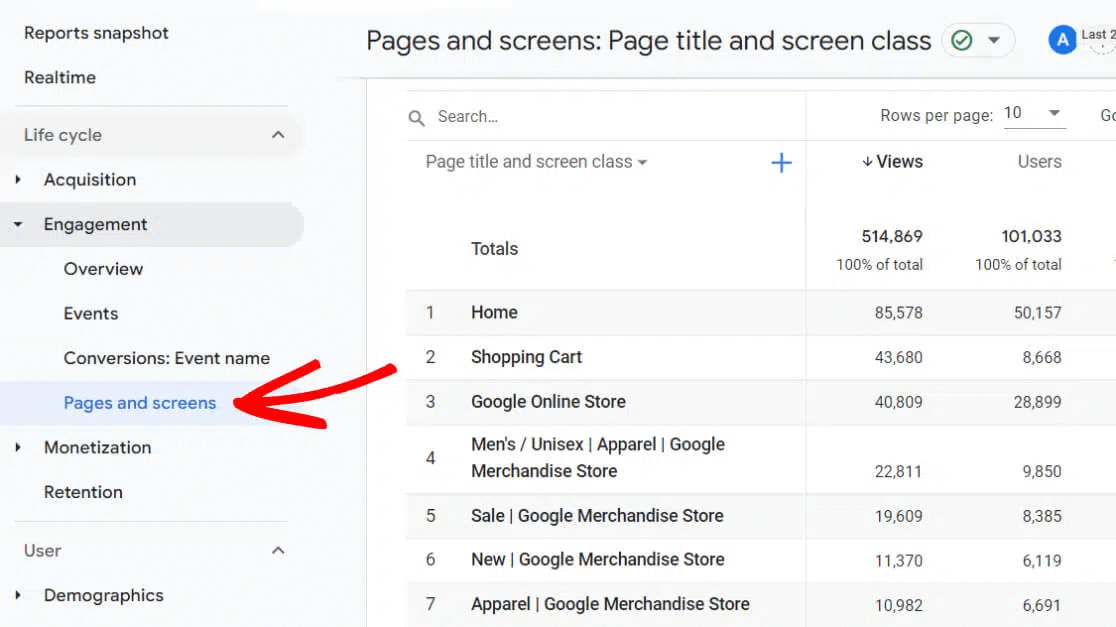
In the table, you’ll see all of your pages that were visited during the time period you have selected along with important metrics. Now, it’s important to understand what these metrics mean, so let’s go over them.
- Views: the total number of views, including views by the same users and same screens.
- Users: the number of individual visitors who viewed that page.
- Views per user: the average number of views by a visitor (calculated as views divided by users).
- Average engagement time: the average length of time that users engage with the page (not including if the page is in another tab, minimized, etc.).
- Event count: the total number of times visitors triggered an event on the page.
- Conversions: the total number of times a conversion event was triggered by visitors.
- Total revenue: the sum of purchase revenue, subscription revenue, and ad revenue.
Using this table, you can see which pages are most popular, which ones your audience is engaging with the most, the pages that are driving conversions or revenue, and more. This a go-to report for understanding how your content is performing.
Landing Page Report
Another area under Engagement that we’ll take a look at is Landing Pages. Here, you can see where users first enter your website to better understand which pages and posts are bringing in traffic.
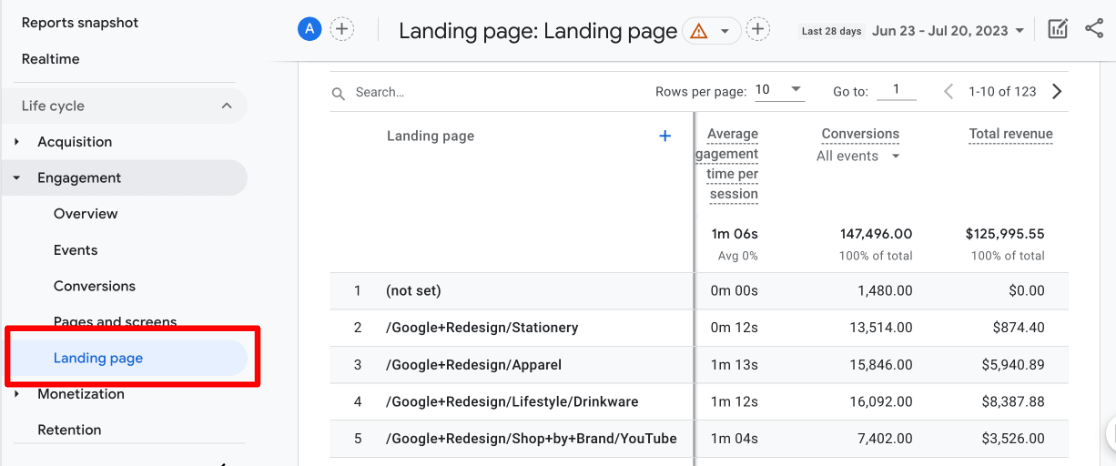
Note: If you don’t see the Landing page report, you may need to add it from your library. Check out this tutorial to see how.
Although the metrics look similar at first glance, remember that these are the pages where visitors first “landed” when visiting your site. You’ll notice that Views has been replaced with Sessions, which you should keep in mind for all the metrics.
Google Analytics records visitors’ behavior on your whole website after they landed on that page. For example, let’s say you have a blog post titled “Best SEO Tips” that visitors often land on through a Google search, social media posts, etc. The metrics for that post in the Landing Page report mean:
- Sessions: the total number of distinct website visits that began on that post.
- Users: the number of unique visitors whose session began with that post.
- New Users: the number of visitors whose first visit to your site started on that post.
- Average Engagement Time per Session: the average amount of time visitors spent engaging on your entire website after landing on that post (viewing other pages etc.).
- Conversions: the total number of conversions that were triggered during sessions that started on that post (even if the conversion then took place on a different page).
- Total Revenue: the sum of purchase revenue, subscription revenue, and ad revenue from sessions that first began on that post.
Monetization
The Monetization section is for eCommerce websites that sell either physical or digital products. If you run an online store, you’ll need to set up eCommerce tracking in Google Analytics first before you can use the reports under monetization.

If you run a WordPress site, you can check out our tutorial on How to Set Up Google Analytics eCommerce Tracking (Simple Way). After it’s set up, you can track purchases, top products, buyer journeys, add-to-cart events, and lots more.
User Attributes
To learn more about your audience and their demographics, you’ll want to check out the User Attributes reports.
Under User, go to User attributes » Overview from your navigation. Similar to the other reports we’ve looked at, you’ll see a number of cards that give you data about your website visitors.
Google Analytics collects location data about visitors by default, so you’ll be able to see City, Country, and Language. However, to see Age, Gender, and Interests, you’ll need to follow our tutorial on how to enable demographic and interest reports in Google Analytics.
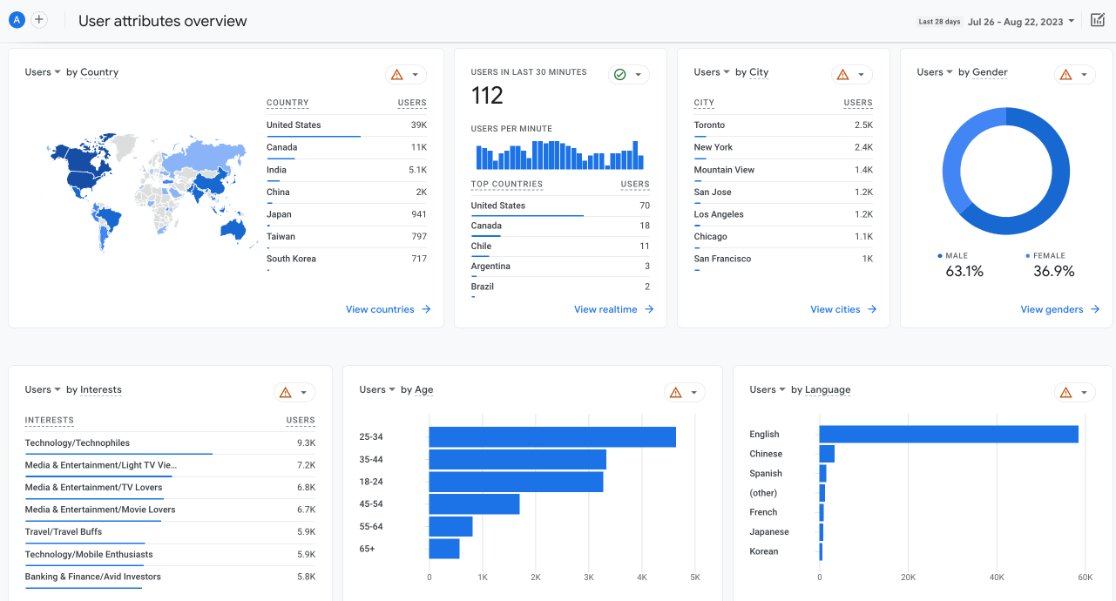
You can click the links at the bottom of each card to see the full in-depth reports. Check out a few of the ways you can use demographics reports to improve your business:
- Find the right target audience, such as age range and gender, and create personalized marketing campaigns and ads that target those users.
- See which languages your visitors speak to know which languages you should translate your popular content into to attract a larger audience.
- Look at interests to see which categories your visitors like. Then, create content or promote products based on their interests.
- If you’re a local business, use the city report to see which suburbs or nearby areas are attracting site visitors, and use that data to hone your location-based marketing efforts.
Tech
Want to see which devices and browsers your website visitors use? The Tech reports let you do exactly that.
In your sidebar menu, click User » Tech » Overview.
Again, you’ll see a bunch of different cards that tell you about the technology used by visitors. See a breakdown by Operating system (IOS, Windows, Macintosh, etc.), Device category (tablet, mobile, desktop), Browser (Chrome, Safari, etc.), and Screen resolution.
To see the full report on any technology aspect, just click the link at the bottom of the card.
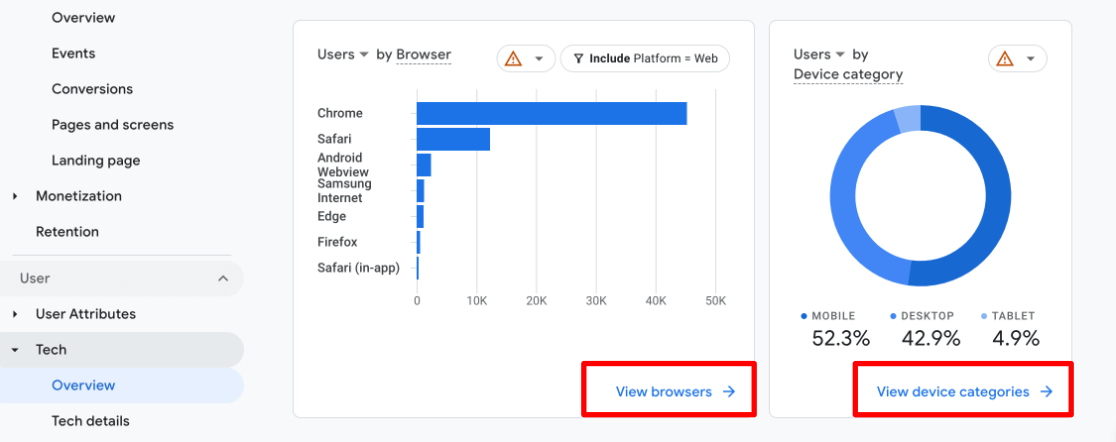
Every website should be optimized for mobile, but the tech reports can help you find out additional information about how visitors interact with your site.
Plus, it can be a helpful tool for spotting any issues your website has with a specific browser or device. For example, in the full browser report, you might see that just as many users are using Safari as Chrome, but Safari has a much higher engagement rate. That could be an indicator that something isn’t optimized as well for Chrome and you should investigate.
We’ve covered all the primary reports in Google Analytics, but there’s still a lot more you can do! Check out our tutorial to learn about creating custom reports in GA4.
Best Way to Use Google Analytics for WordPress
Now that you’ve got a solid understanding of what Google Analytics does, let’s take a look at a much easier way to get your GA4 reports without ever leaving WordPress.
- Overview Report
- Traffic Reports
- Publishers Reports
- Search Console Report
- eCommerce Report
- Forms Report
- Custom Dimensions
- Realtime Report
ExactMetrics is the best premium WordPress Analytics plugin, allowing you to easily set up Google Analytics without editing any code or needing a complicated tool like Google Tag Manager. You get advanced tracking right out of the box with an extremely user-friendly interface and Google Analytics reports right inside your WordPress dashboard.
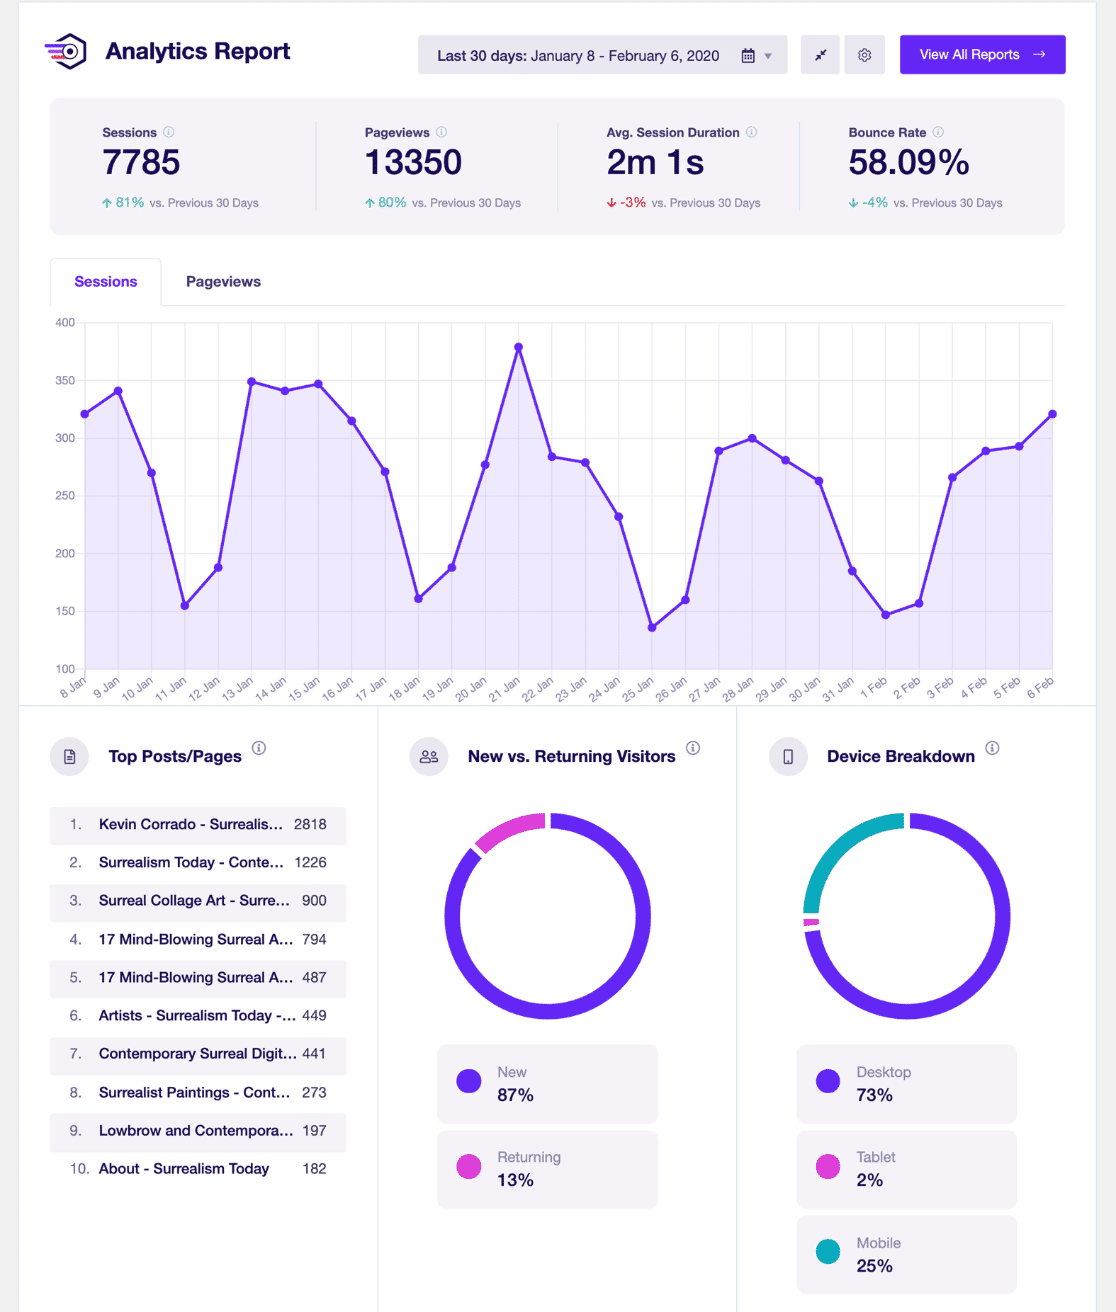
Plus, you gain access to tons of additional Google Analytics features and advanced tracking functionality with just a few simple clicks.
Here are some of ExactMetrics’ most popular features:
- Custom event tracking and custom dimensions
- 1-click eCommerce tracking
- Conversion tracking for Google Ads, Microsoft (Bing) Ads, and Meta (Facebook) Ads
- Display your most popular posts or products
- Advanced form tracking and integration with the most popular form builders
- EU/GDPR Compliance
- Affiliate and outbound link tracking
- Social media tracking
- Media and video play tracking
- And much more…
ExactMetrics makes using Analytics very easy and saves a ton of time for beginners and experts alike. With only a few clicks, the plugin takes care of all the complicated Google Analytics configuration behind the scenes and brings your important Google Analytics reports and advanced tracking to your WordPress dashboard.
Let’s take a look at some of the reports you’ll get in WordPress when you use ExactMetrics.
Overview Report
Up first, is the Overview report. Here, you can view your site’s Sessions, Pageviews, Average Session Duration, and Total Users.
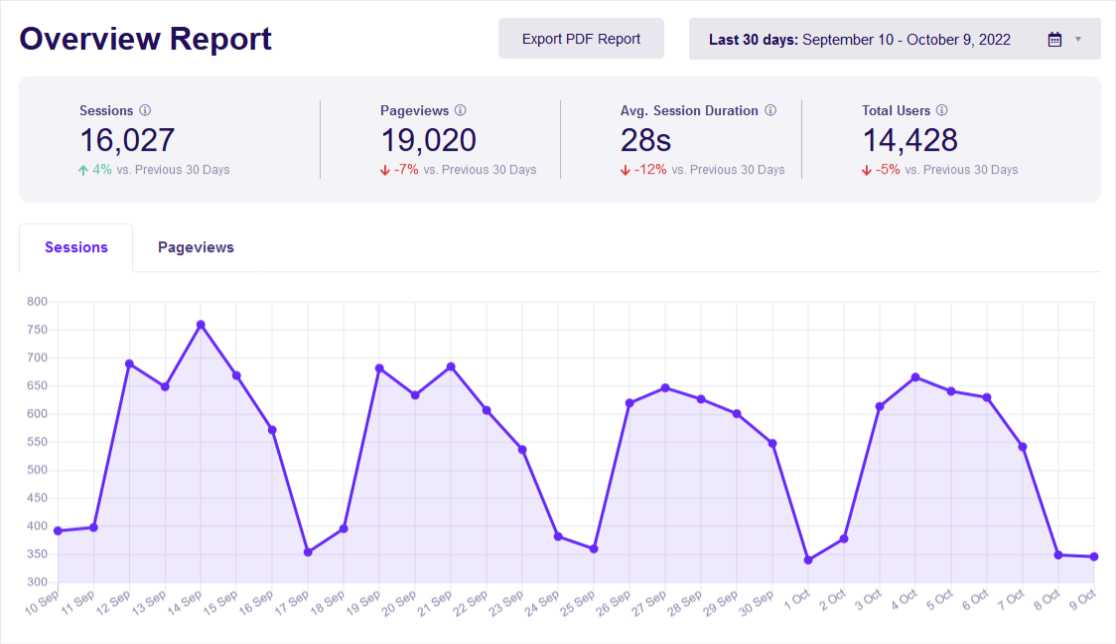
Not only that, but you can also scroll down in the report to more key metrics:
- New vs. Returning: percentage of new users
- Device: breakdown of mobile vs. desktop vs. tablet
- Top 10 Countries: Top countries where your visitors are from
- Top 10 Referral: Top websites sending traffic to your site
- Top posts/pages: A quick view of your most popular pages and views for each
Traffic Reports
There are a number of reports in ExactMetrics to help you see where your traffic is coming from. You can use the Traffic Overview report to quickly see which channels your visitors are coming from.
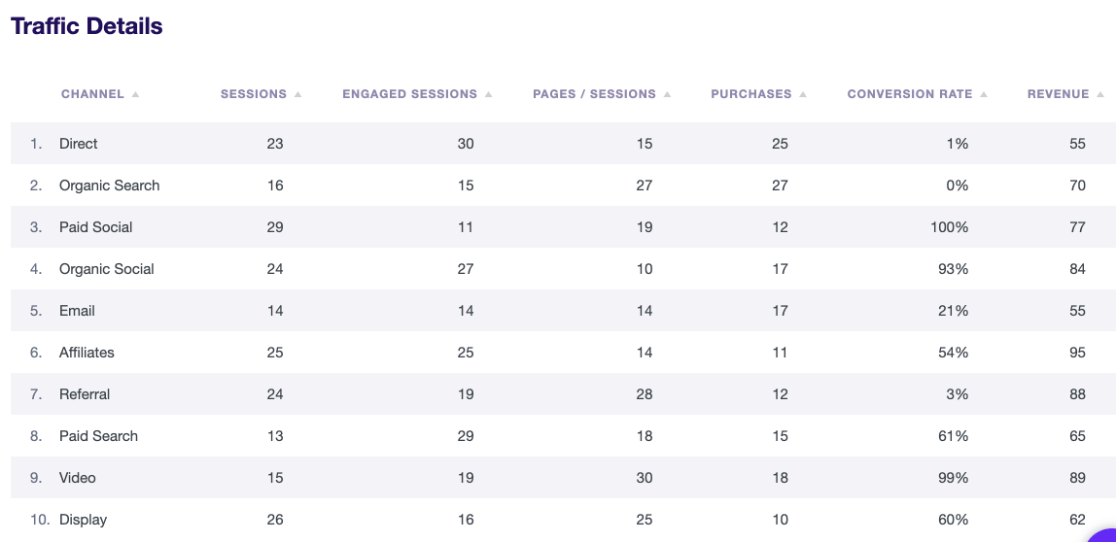
To get a more detailed view of the sources sending traffic to your site, just click the Source/Medium report.
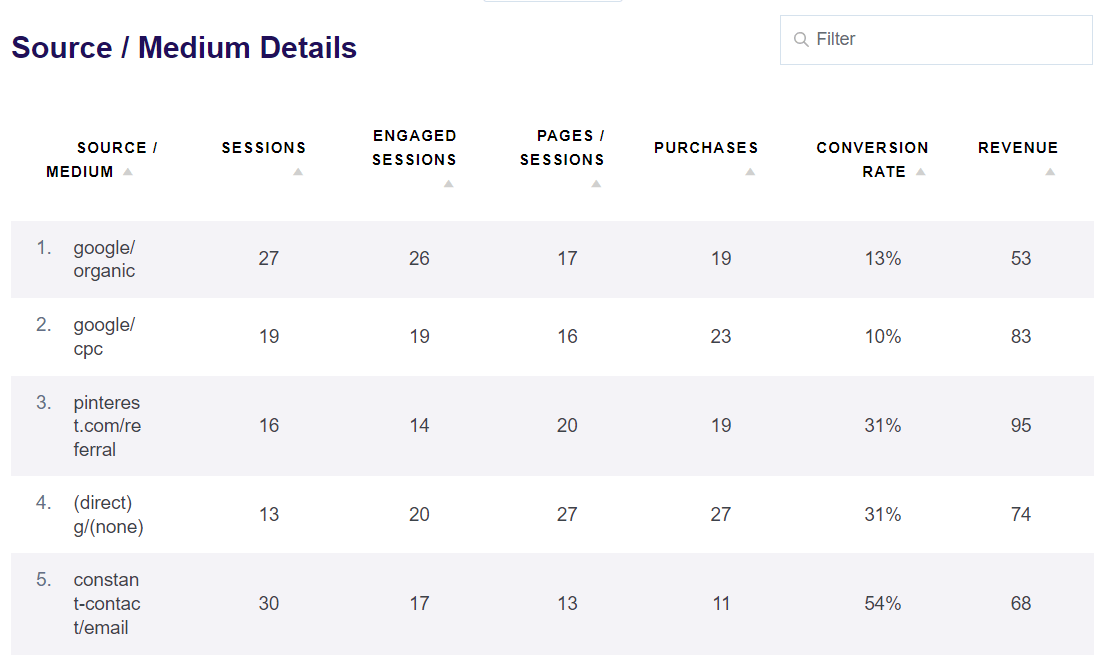
Aside from these two reports, you’ll also find these reports under the Traffic tab in ExactMetrics:
- Landing Page Details: Your top landing pages along with key metrics that you would typically find in Google Analytics.
- Technology: A breakdown of the devices and browsers that visitors use.
- Campaigns: Traffic from your campaigns (UTM parameters) along with metrics for each like engaged sessions, conversion rate, and more.
Publishers Reports
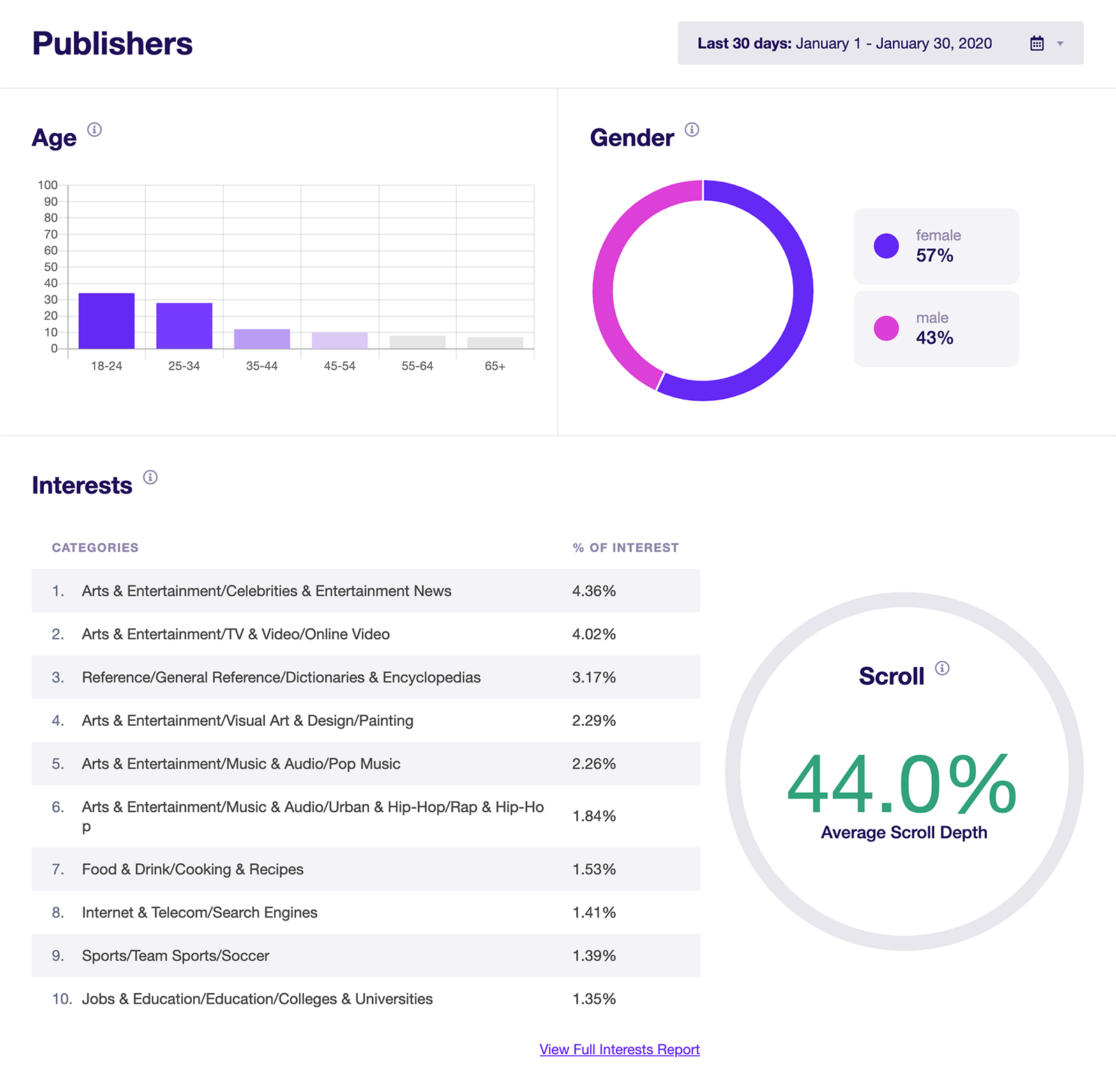
The next reports you can view in ExactMetrics are under Publishers. You’ll find an at-a-glance view of your Top Landing Pages with views, average duration, and bounce rate. You can see a number of other important reports including:
- Top Outbound Links: Links your visitors are clicking that lead away from your site.
- Top Affiliate Links: Affiliate links that are getting the most clicks.
- Top Download Links: Download links that visitors click the most.
- Detailed Pages Report: Your top pages along with views, engaged sessions, new sessions, and bounce rate.
In the Publishers Overview, you’ll also find a breakdown of your audience demographics with age, gender, and interests as well as average scroll depth.
Search Console Report
Do you wonder which keywords your site ranks for on Google? If so, the Search Console report can tell you. This report is extremely useful if you’re trying to bring in more organic traffic and perform SEO (search engine optimization).
This isn’t a standard report in Analytics, but ExactMetrics helps you easily connect Google Search Console to Google Analytics and shows your Top 50 Google Search Terms right in WordPress.
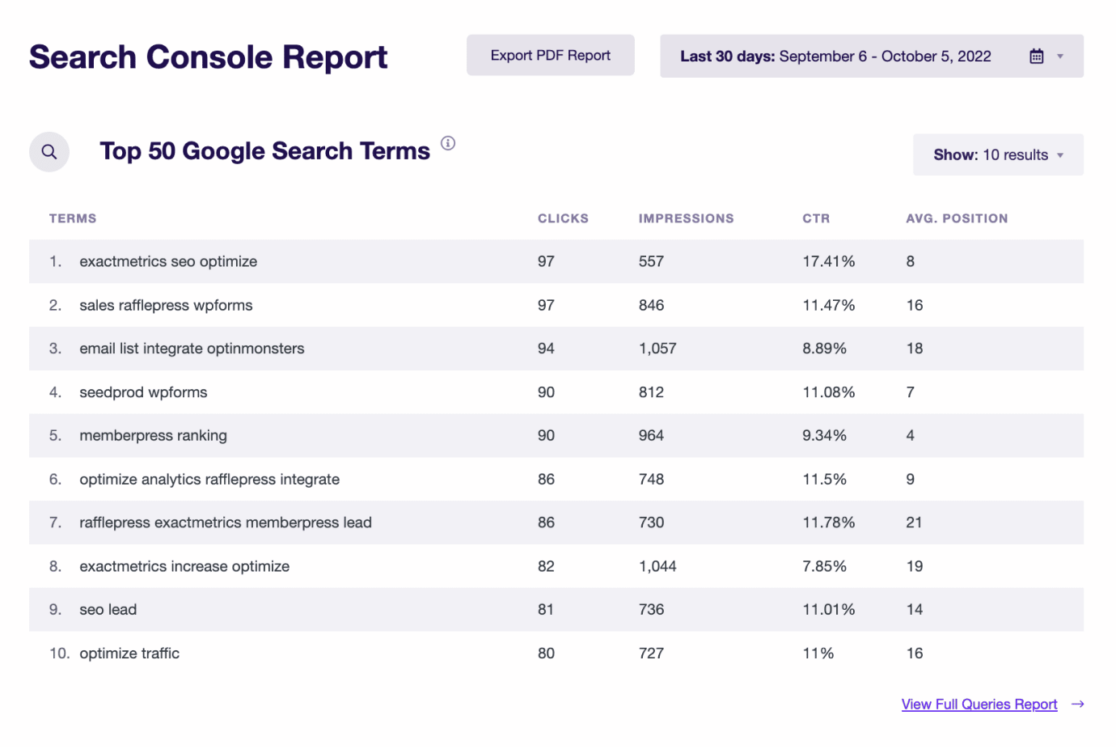
Plus, if you use an SEO plugin like AIOSEO or Yoast, ExactMetrics can track your focus keywords and show you how they’re performing.
eCommerce Report
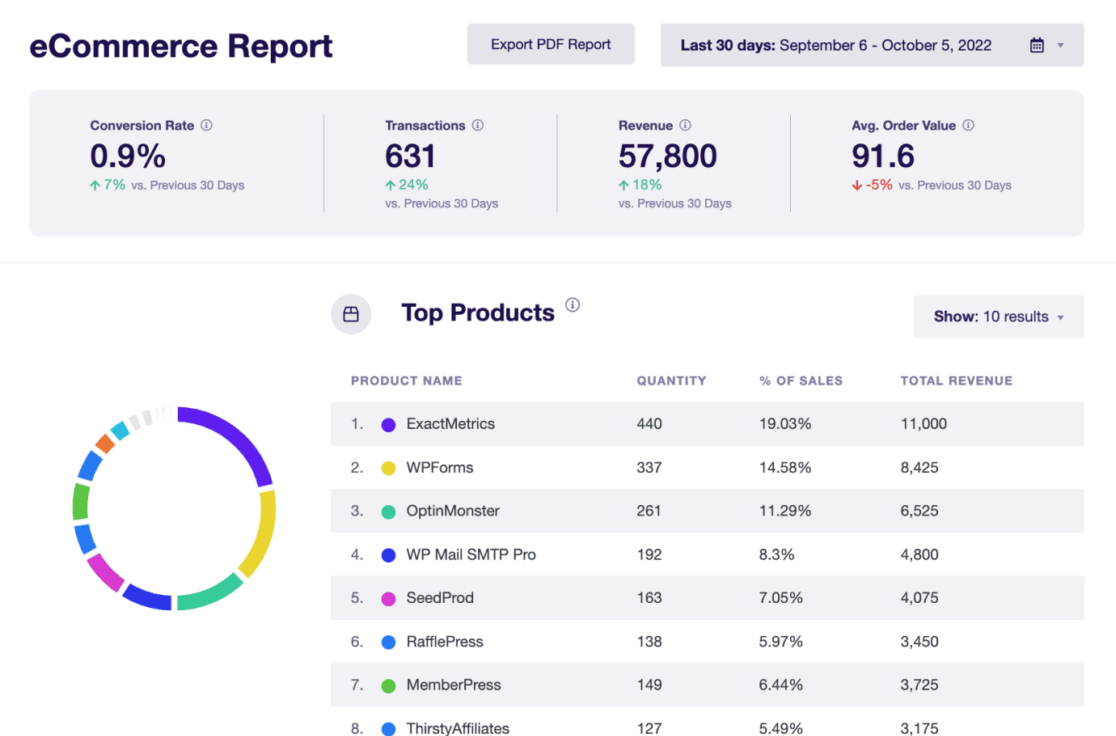
The plugin also helps you configure advanced tracking for eCommerce with 1-click. Then in the eCommerce report, you can view your site’s conversion rate, total transactions, revenue, and average order value. The report also shows your Top Products, so you can see which products are bringing in the most revenue.
Other eCommerce reports you’ll be able to view include:
- Top Conversion Sources: The websites that are sending high-converting traffic to your online store.
- New Customers: percentage of first-time purchasers.
- Abandoned Checkout Rate: how often users abandon a purchase.
- eCommerce Events: Total add-to-cart and remove-from-cart events.
- Coupons: discount codes used on your site and how often they’re used, revenue, and more.
- Funnel: a visual report of users in the buying journey and where they drop off (WooCommerce and Easy Digital Downloads).
- User Journey: Every step in customers’ journeys to purchase even over multiple days and session along with how long each step takes, campaign source, and more.
Forms Report
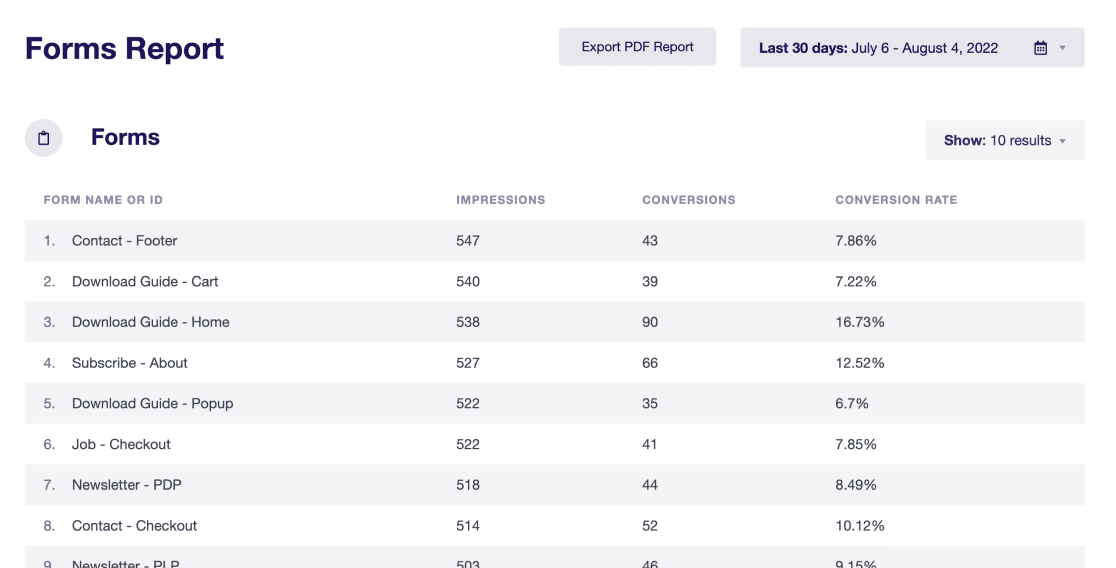
Another advanced tracking feature offered by ExactMetrics is form conversions. Google Analytics doesn’t track your forms by default. But with ExactMetrics, you can start to see how well your forms are performing in an instant. No additional setup is required, and it works for every form builder!
Custom Dimensions
If you want to track additional performance metrics for your website that aren’t available by default in Google Analytics, you can set up custom dimensions with just a couple of clicks in ExactMetrics.
For instance, you can track your Most Popular Categories and Most Popular Authors.
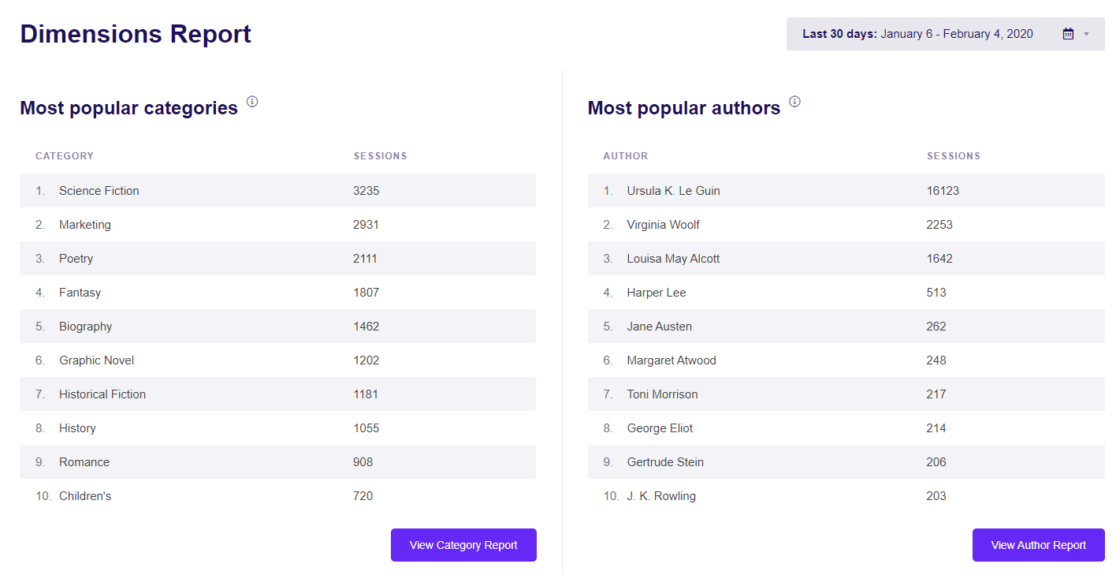
Other custom dimensions you can track with ExactMetrics include:
- Focus Keywords
- Top Tags and Categories
- SEO Score
- Top Post Types
- Best Publication Time
- Logged-In Sessions
Realtime Report
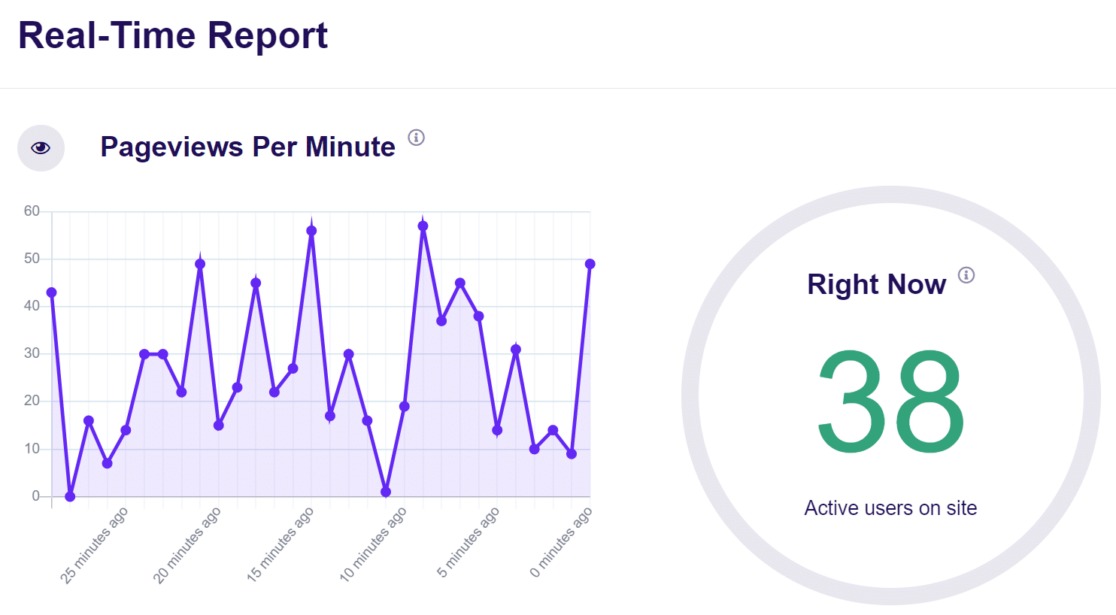
The last report you can view in ExactMetrics is your traffic in real-time. It brings your Realtime report from Google Analytics and shows it in your WordPress dashboard.
You can see instant results of your campaigns without having to leave your website.
And that’s it!
We hope this beginner’s guide to Google Analytics has cleared up a lot of the mystery around how Google Analytics works. Now, you can start using it to make data-driven decisions that grow your business.
If you enjoyed this article, be sure to check out our Essential On-Page SEO Guide for WordPress.
Not using ExactMetrics yet? What are you waiting for?
Don’t forget to follow us on Twitter and Facebook to see all the latest reviews, tips, and Google Analytics tutorials.

